Are Our Roads and Bridges Actually Crumbling? It Depends on Where You Live!
During his State of the Union Address President Trump said:
As we rebuild our industries, it is also time to rebuild our crumbling infrastructure.
America is a nation of builders. We built the Empire State Building in just 1 year — is it not a disgrace that it can now take 10 years just to get a permit approved for a simple road?
I am asking both parties to come together to give us the safe, fast, reliable, and modern infrastructure our economy needs and our people deserve.
Tonight, I am calling on the Congress to produce a bill that generates at least $1.5 trillion for the new infrastructure investment we need.
Every Federal dollar should be leveraged by partnering with State and local governments and, where appropriate, tapping into private sector investment — to permanently fix the infrastructure deficit.
Any bill must also streamline the permitting and approval process — getting it down to no more than two years, and perhaps even one.
Together, we can reclaim our building heritage. We will build gleaming new roads, bridges, highways, railways, and waterways across our land. And we will do it with American heart, American hands, and American grit. [Emphasis added]
According to data from Transportation.gov the “crumbling infrastructure” that President Trump referred to depends on where you live. The states in which over 70% of roads are in “poor/mediocre condition are Colorado (70%), Oklahoma (70%), Wisconsin (71%), Illinois (73%) and Connecticut (73%). The top two states with the highest percentage of “structurally deficient/functionally obsolete bridges are Massachusetts (52.5%) and Hawaii (43.9%). See the chart below for a state by state breakdown of the status of bridges and roads and the cost to repair them.
Why is infrastructure important?
In a Motor Trend magazine article titled “Tapping the Brakes: Autonomous-car Society is Still Decades Away” Mark Rechtin reports:
Pull out any issue of Popular Science from the past 50 years, and you’ll likely find a story predicting that we would be living in a world of self-driving cars any decade now. (You can add in recent long-form pieces by other national media that push that Jetsons-tinged future even harder.)
[ … ]
But the truth is we are still a long way from a fully self-driving society, for several very key reasons that have nothing to do with our ability to create the technology. Here is the cocktail party checklist of the interrelated barriers we face:
Infrastructure: Autonomous vehicles need roadways that are well-marked and in good shape. There are 4.12 million miles of road in America, according to the Federal Highway Administration, of which 2.68 million miles are paved. How bad are our roads? According to the FHA, 42.1 percent of Connecticut’s federal-aid highway miles are in “poor or mediocre condition.” Traffic-choked California is close behind, with 35.1 percent in terrible shape.
Rechtin concludes, “The ability to create autonomous vehicles is not at issue. At issue is how to incorporate 21st century technology into a world that is still mired in the 20th. And that will take time.”
Why are our roads mired in the 20th century?
According to Transportation.gov:
The Highway Trust Fund is set to expire on July 31. Without action from Congress, federal funding for transportation will come to a screeching halt — and with it, so will traffic in many places. Over the last six years, Congress has passed 33 short-term measures rather than funding transportation for the long term. And our transportation system — our roads and bridges, especially — is in a dire state of disrepair because of it. The attached fact sheet shows us this.
Experts agree: The only way to prepare our transportation system for the next generation is to stop this cycle of short-term measures and pass a long-term transportation bill. [Emphasis added]
So there you have it. Taxes are paid to Congress every-time you fill your tank but Congress can’t get its act together and pass a single year transportation bill let alone a long-term bill.
It’s the Congress stupid!
RELATED ARTICLES:
Trump Releases Infrastructure Plan Focused on Deregulation and New Funding
Our Roads and Bridges Are Not Actually Crumbling
Hawaii Highways Rank 47th in Cost-Effectiveness
| State | Structurally Deficient / Functionally Obsolete Bridges* | Annual Total Extra Vehicle Repairs / Operating Costs Due to Driving on Roads in Need of Fixing** | Percentage of Roads in Poor / Mediocre Condition** |
|---|---|---|---|
| ALABAMA | 3,608 of the 16,078 (22.4%) | $530 million ($141 per motorist) | 25% |
| ALASKA | 290 of the 1,196 (24.2%) | $181 million ($359 per motorist) | 49% |
| ARIZONA | 954 of the 7,862 (12.1%) | $887 million ($205 per motorist) | 52% |
| ARKANSAS | 2,894 of the 12,748 (22.7%) | $634 million ($308 per motorist) | 39% |
| CALIFORNIA | 6,953 of the 24,955 (27.9%) | $13.892 billion ($586 per motorist) | 68% |
| COLORADO | 1,438 of the 8,612 (16.7%) | $1.034 billion ($287 per motorist) | 70% |
| CONNECTICUT | 1,472 of the 4,218 (34.9%) | $847 million ($294 per motorist) | 73% |
| DELAWARE | 177 of the 864 (20.5%) | $168 million ($257 per motorist. | 36% |
| FLORIDA | 2,044 of the 12,070 (16.9%) | $1.792 billion ($128 per motorist) | 26% |
| GEORGIA | 2,600 of the 14,769 (17.6%) | $374 million ($60 per motorist) | 19% |
| HAWAII | 494 of the 1,125 (43.9%) | $456 million ($515 per motorist) | 49% |
| IDAHO | 859 of the 4,232 (20.3%) | $316 million ($305 per motorist) | 45% |
| ILLINOIS | 4,246 of the 26,621 (15.9%) | $2.4 billion ($292 per motorist) | 73% |
| INDIANA | 4,168 of the 18,953 (22%) | $1.249 billion ($225 per motorist) | 17% |
| IOWA | 6,271 of the 24,398 (25.7%) | $756 million ($381 per motorist) | 46% |
| KANSAS | 4,465 of the 25,171 (17.7%) | $646 million ($319 per motorist) | 62% |
| KENTUCKY | 4,436 of the 14,116 (31.4%) | $543 million ($185 per motorist) | 34% |
| LOUISIANA | 3,790 of the 13,050 (29%) | $1.2 billion ($408 per motorist) | 62% |
| MAINE | 791 of the 2,402 (32.9%) | $246 million ($245 per motorist) | 53% |
| MARYLAND | 1,418 of the 5,291 (26.8%) | $1.598 billion ($422 per motorist) | 55% |
| MASSACHUSETTS | 2,694 of the 5,136 (52.5%) | $1.461 billion ($313 per motorist) | 42% |
| MICHIGAN | 3,018 of the 11,022 (27.4%) | $2.534 billion ($357 per motorist) | 38% |
| MINNESOTA | 1,513 of the 13,137 (11.5%) | $797 million ($250 per motorist) | 52% |
| MISSISSIPPI | 3,636 of the 17,044 (21.3%) | $811 million ($419 per motorist) | 51% |
| MISSOURI | 6,633 of the 24,350 (27.2%) | $1.6 billion ($380 per motorist) | 31% |
| MONTANA | 882 of the 5,126 (17.2%) | $136 million ($184 per motorist) | 52% |
| NEBRASKA | 3,765 of the 15,370 (24.5%) | $380 million ($282 per motorist) | 59% |
| NEVADA | 253 of the 1,853 (13.7%) | $391 million ($233 per motorist) | 20% |
| NEW HAMPSHIRE | 790 of the 2,438 (32.4%) | $267 million ($259 per motorist) | 54% |
| NEW JERSEY | 2,334 of the 6,566 (35.5%) | $3.476 billion ($601 per motorist) | 66% |
| NEW MEXICO | 654 of the 3,935 (16.6%) | $397 million ($291 per motorist) | 44% |
| NEW YORK | 6,775 of the 17,442 (38.8%) | $4.551 billion ($403 per motorist) | 60% |
| NORTH CAROLINA | 5,534 of the 18,168 (30.5%) | $1.555 billion ($241 per motorist) | 45% |
| NORTH DAKOTA | 966 of the 4,439 (21.8%) | $112 million ($237 per motorist) | 44% |
| OHIO | 6,647 of the 27,015 (24.6%) | $1.685 billion ($212 per motorist) | 42% |
| OKLAHOMA | 5,828 of the 22,912 (25.4%) | $978 million ($425 per motorist) | 70% |
| OREGON | 1,754 of the 7,656 (22.9%) | $495 million ($173 per motorist) | 65% |
| PENNSYLVANIA | 9,561 of the 22,660 (42.2%) | $2.947 billion ($341 per motorist) | 57% |
| RHODE ISLAND | 433 of the 766 (56.5%) | $350 million ($467 per motorist) | 70% |
| SOUTH CAROLINA | 1,920 of the 9,275 (20.7%) | $811 million ($255 per motorist) | 40% |
| SOUTH DAKOTA | 1,459 of the 5,875 (24.8%) | $194 million ($324 per motorist) | 61% |
| TENNESSEE | 3,802 of the 20,058 (19%) | $809 million ($182 per motorist) | 38% |
| TEXAS | 9,998 of the 52,561 (19%) | $5.27 billion ($343 per motorist) | 38% |
| UTAH | 437 of the 2,974 (14.7%) | $332 million ($197 per motorist) | 25% |
| VERMONT | 903 of the 2,731 (33.1%) | $230 million ($424 per motorist) | 45% |
| VIRGINIA | 3,588 of the 13,765 (26.1%) | $1.344 billion ($254 per motorist) | 47% |
| WASHINGTON | 2,066 of the 7,902 (26.1%) | $1.349 billion ($272 per motorist) | 67% |
| WEST VIRGINIA | 2,514 of the 7,125 (35.3%) | $372 million ($273 per motorist) | 47% |
| WISCONSIN | 1,970 of the 14,088 (14%) | $1.147 billion ($281 per motorist) | 71% |
| WYOMING | 723 of the 3,099 (23.3%) | $96 million ($236 per motorist) | 47% |
*According to 2013 data from the Federal Highway Administration
**According to the American Society of Civil Engineers 2013 Report Card for America’s Infrastructure
Updated: Thursday, October 13, 2016
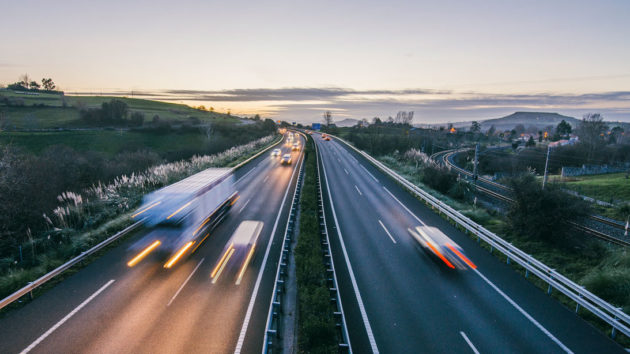
EDITORS NOTE: The featured image of a highway at dusk is courtesy of The Daily Signal. Photo: MarioGuti/Getty Images.


Leave a Reply
Want to join the discussion?Feel free to contribute!