Who benefits from government spending? You will be surprised!
The Tax Foundation’s Gerald Prante, PhD and Scott Hodge released a report titled “The Distribution of Tax and Spending Policies in the United States. “While most of the debate in Washington, D.C. centers around who should bear the greatest tax burden, few ask who benefits the most from government spending programs.
If you want equality then the ideal situation would be you receive $1 of benefit for every $1 of tax paid. That would be fair. But that is not the case in the United States.
Prante and Hodge report, “Fiscal policy in the United States has undergone many significant changes since 2000, especially at the federal level. From 2001 through 2006, President Bush and the Republican Congress enacted many income tax cuts, most of which are still in effect today. These tax cuts were primarily across-the-board tax cuts that cut taxes for all income taxpayers. In 2009, President Obama and the Democratic Congress enacted even more tax cuts, primarily targeted at low-and-middle income taxpayers. That portion of the Bush tax cuts that went to high-income taxpayers was eventually scaled back in 2013. This study’s final year, however, is 2012, a year in which the Bush income tax cuts for high-income earners were still fully in place.”
“While the federal government was cutting income taxes over the past twelve years, it was also increasing spending,” note Prante and Hodge.
Prante and Hodge found:
- The question of who benefits from government spending is just as important as the question of who pays taxes. In other words, how do tax and spending policies redistribute income?
- America’s lowest-income families receive $5.28 worth of government spending (federal, state, and local) for every $1 they pay in total taxes. Middle-income families receive $1.48 in total spending per tax dollar, while America’s highest-income families receive $0.25 cents in spending for every dollar of taxes paid.
- As a group, the bottom 60 percent of American families receive more back in total government spending than they pay in total taxes.
- Government tax and spending policies combine to redistribute more than $2 trillion from the top 40 percent of families to the bottom 60 percent.
- The total amount of redistribution has increased slightly over the past 12 years. Middle-income and working lower-income families were the biggest beneficiaries.
- Lawmakers can remove equity as an issue in tax reform by matching any loss in progressivity on the tax side with an equal increase in progressivity on the spending side.
Prante and Hodge state, “These findings have particular relevance to the current tax reform debate because distributional issues are one of the key sticking points to reform proposals that would cut marginal tax rates while broadening the tax base. But tax progressivity is only half the picture, because progressivity can be achieved through both taxes and spending. Thus, if moving to a flatter, more economically neutral tax code reduces progressivity in the tax code, overall progressivity of the fiscal system can be maintained with slight adjustments to federal spending.”

For a larger view click on the chart.
The Heritage Foundation reports that in the 2013 Federal Budget:
- Washington will spend nearly $3.5 trillion in 2013 while collecting $2.8 trillion in revenues, resulting in a deficit of $642 billion.
- Over the past 20 years, federal spending grew 63 percent faster than inflation.
- Mandatory spending, including Social Security and means-tested entitlements, doubled after adjusting for inflation. Discretionary spending grew by 49 percent.
- Despite publicly held debt surging to three-fourths the size of the economy (as measured by GDP), net interest costs have fallen as interest rates have dropped to historic lows.
- In 1963, defense spending was 9 percent of GDP and mandatory spending on entitlement programs was 6.1 percent of GDP, one-third lower.
- In 2013, spending on defense is at about 4 percent of GDP and falling, while mandatory spending (including net interest) is reaching 14.5 percent of GDP and growing.
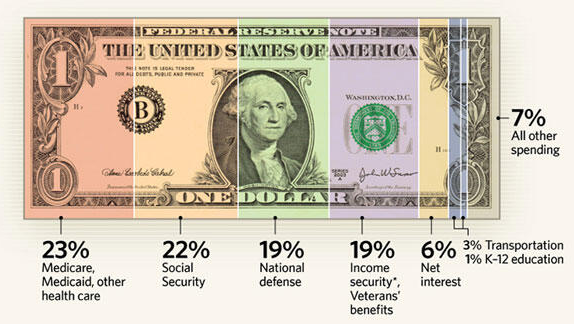
Where Did All the Money Go?
- 31 cents of every dollar Washington spent in 2012 was borrowed, resulting in a $1.1 trillion deficit.
- 45 percent, or almost half of all spending ,went toward paying for Social Security and health care entitlements (primarily Medicare and Medicaid). In 2002, that was only 25 percent. Without reform of these massive and growing programs, Washington will have to borrow increasing amounts of money, piling debt onto younger generations and putting the nation on a dangerous economic course.
- Social Security is the largest federal spending program and has held this position since surpassing defense in 1993.
- Medicare is one of the largest and fastest-growing programs in the entire federal budget.
- The U.S. Postal Service has been losing money for several years and is drawing down reserves to cover losses. Congress should allow the USPS to restructure and meet the needs of today’s marketplace. Otherwise, taxpayers will be on the hook when reserves run out.
- Energy spending has exploded, yet the increases in oil and gas production have happened on state and private lands.
Everyone owns the debt. Every taxpayer has an estimated liability of over $1.1 million. Borrowing from Peter to pay Paul will eventually fall like a ton of bricks equally on every American.
The Ryan-Murry budget agreement only makes matters worse, much worse.


Leave a Reply
Want to join the discussion?Feel free to contribute!