FHA Watch: 87% of FHA’s October home purchase loans were High Risk
For the fifth year in a row, the FHA has violated federal law by failing to meet its minimum capital standard of 2 percent—equal to about $22 billion on its $1.1 trillion book of insurance in force. The 2013 Actuarial Study found that the FHA had an economic net worth of −$8 billion, up from −$13.5 billion last year but still $30 billion short of the 2 percent statutory standard. This projection assumes moderate house price appreciation averaging 3–3.5 percent over the next 28 years and that a recession is unlikely over the next few years.
Under this rosy scenario, it is no surprise that each new book of business the FHA adds looks profitable. It is also no surprise it has had to revise the expected cumulative claim rates for the 2009-2012 vintages substantially upward from last year’s estimates (for example, 2009 was raised from 13.25 percent to 15.44 percent).
Under the new AEI Mortgage Risk Index, the FHA’s home purchase loans are almost exclusively high risk (87 percent) with 13 percent being medium risk and 0.3 percent being low risk. From 1935 to 1955, nearly 100 percent of FHA loans would have qualified as low risk. The preponderance of high-risk loans today helps explain why the FHA’s delinquency rate remains stubbornly high at 15 percent and its private GAAP net worth has improved only modestly, from −$27 billion in September 2012 to −$25 billion this month. These are not indicators of a financial institution on the road to recovery.
Consider that the current economic expansion is 54 months old, about on par with the World War II standard of 58 months. Given that the standard deviation of postwar expansions is 33.4 months, a recession sometime in the next couple of years is likely. At the same time, unemployment is at 7 percent, an unusually high rate this far along in an expansion. Since the unemployment rate generally rises by about two percentage points in a recession, a rate of 8.5–9 percent might be expected if the United States does enter a new recession.
The threat the FHA poses is demonstrated by the alternate scenarios contained in the actuarial study. For example, it has a −$23 billion economic value today under the 10th-worst scenario, one that likely equates to the impact of a near-term recession. This $15 billion decline in value compared to the baseline case is nearly enough to wipe out the FHA’s minimum statutory capital requirement of 2 percent or $22 billion.
Bottom line—if the economy catches a cold, the FHA gets pneumonia. It is time Congress and the FHA faced facts: the FHA poses great risks to the taxpayer and places most of its insured home buyers into high-risk loans.
Spotlight on Best Price Execution
Planned GSE Guarantee Fee Increase Adds to Ginnie Agency Price Advantage over Fannie
Table 1 demonstrates the pricing advantages the Ginnie/FHA, Ginnie/US Department of Agriculture (USDA), and Ginnie/Veterans Affairs (VA) divisions have over Fannie Mae. FHA, VA, and USDA pricing advantages have increased by about $500 compared to last month because of a 14-basis-point guarantee fee on Fannie loans announced on December 9, 2013.
Table 1. Best Price Execution (Ginnie pricing advantages in bold)
Source: Adapted from JPMorgan’s 2012 Securitized Products Outlook, November 23, 2011, 18.
Note: Mortgage-backed securities (MBS) pricing from MBS Live, published by Mortgage News Daily. Comparison based on MBS pricing as of December 14, 2013. On that date, a Ginnie 30-year MBS with a coupon of 4.0 percent had a price of 104.25, and a Fannie 30-year MBS with the same 4.0 percent coupon had a price of 103.31. These prices were then adjusted based on the present value (where necessary) of applicable borrower-paid credit fees, mortgage insurance premiums, and the value of the base servicing fee. Fannie’s guarantee fee was increased by 10 basis points effective April 2012, as mandated by Congress, by 10 basis points again as announced on August 31, 2012, by the Federal Housing Finance Agency, and by 14 basis points as announced on December 9, 2013, by the Federal Housing Finance Agency All publicly announced FHA premium increases are included. USDA and VA premiums are unchanged. FHA, USDA, and VA pricing includes loan-level pricing adjustments made by Carrington Wholesale Services.
On the whole, the five divisions of the Government Mortgage Complex (along with Freddie Mac) have substantial pricing and underwriting advantages over the private sector. The result is that the Government Mortgage Complex’s share of the entire first-mortgage market continues to be at about 85 percent.
Spotlight on Insolvency
FHA’s Private GAAP-Estimated Net Worth Declines to Lowest Level in Nine Months
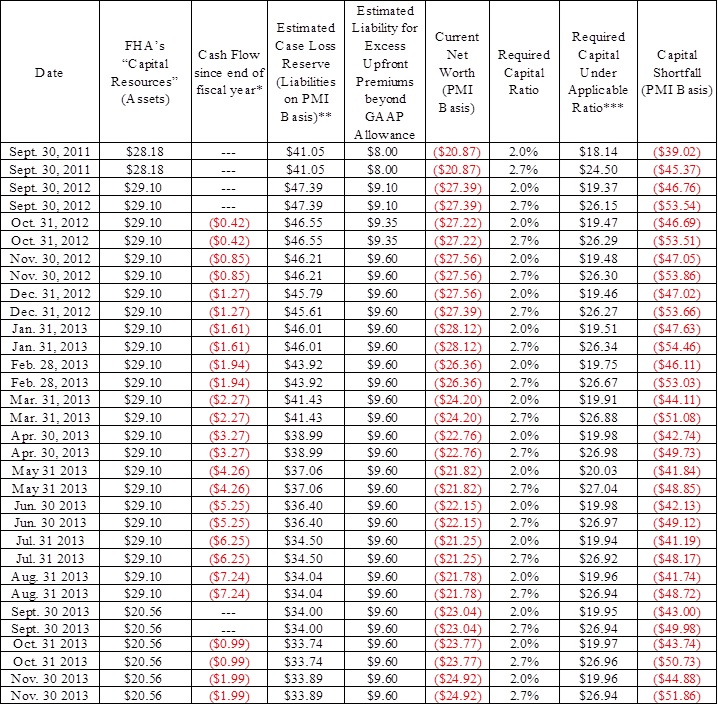
This month, the FHA’s private GAAP-estimated net worth deteriorated by slightly over $1 billion. The estimate for November of the FHA’s GAAP net worth is –$24.92 billion, down from –$23.77 billion in October 2013 (revised), up from –$27.39 billion in September 2012 (revised), and down from –$20.87 billion in September 2011. The capital shortfall stands at $45 billion (using a 2 percent capital ratio) and $52 billion (using a 4 percent capital ratio adjusted to 2.7 percent based on expected recoveries). The Denial Dial was reset to −2.27 percent.
Please see the notes to table A1 for a detailed explanation, including comprehensive adjustments made based the GAO analysis described here.[4]
Spotlight on Delinquency
All Rates Experience Moderate Increases from October to November
In November, 14.96 percent of all FHA loans were delinquent, up from 14.70 percent in October 2013 and down from 16.48 percent in November 2012. The FHA’s overall delinquency rate is stubbornly high, notwithstanding the declining unemployment rate, the multiyear addition of what it describes as lower-risk loans to its insurance book, and the sale in 2013 of a substantial number of delinquent notes.
Most of the increase was due to the 30-day delinquency rate increasing from 4.81 percent in October to 5.01 percent in November.
The serious delinquency rate increased modestly to 8.05 percent from 8.02 percent in October 2013 and decreased from 9.56 percent in November 2012.
For the monthly data tabulation, see table A2 in the appendix.
Appendix: Historical Data Tables
Table A1. Insolvency Watch ($ Billions)
Notes: Table A1 has been revised based on FHA’s FY2013 Actuarial Review excluding HECMs (Forward Mortgage Program), http://portal.hud.gov/
(accessed October 29, 2013).
*The FHA’s negative cash flow was $994 million per month during Q3 of FY 2013. See exhibit 10, US Department of Housing and Urban Development, FHA Single-Family Mutual Mortgage Insurance Fund Programs, Quarterly Report to Congress, 13. The FHA raised its upfront premium from 1 to 1.75 percent (excluding streamline refinances) effective for case numbers assigned on or after April 9, 2012. Since under private GAAP accounting this amount would not be taken into income immediately, it will be accounted for in the “Estimated liability for excess upfront premiums beyond GAAP allowance.” The amount of this liability was estimated at $9.60 billion as of September 30, 2013.
**Outstanding balance of loans 60-days-plus delinquent based on loan counts on applicable date times average loan balance for loans going to claim of $126,524. Reserve levels have been calculated based on termination and claim loss experience as reported in the report series entitled “Quarterly Report to Congress on the Financial Status of the MMI Fund,” FY 2013 Q3, exhibit 5, http://portal.hud.gov/
***Total based on the FHA’s total amortized risk-in-force net of loans covered by loan loss reserve.
Table A2. National Delinquency Watch
End Date |
30-Days Delinquency Rate and Number of Loans | 60-Days-Plus Delinquency Rate and Number of Loans | 30-Days-Plus Delinquency Rate and Number of Loans | Serious Delinquency | Total Loans |
| Jan. 2011 | N/A | N/A | N/A | 8.9% / 612,443 | 6,882,984 |
| Mar. 2011 | N/A | N/A | N/A | 8.3% / 580,480 | 6,983,893 |
| June 2011 | 5.79% / 411,258 | 10.55% / 749,204 | 16.62% / 1,160,462 | 8.34% / 592,366 | 7,103,531 |
| Sept. 2011 | 5.70% / 413,834 | 11.08% / 803,899 | 16.78% / 1,217,733 | 8.77% / 636,778 | 7,258,328 |
| Dec. 2011 | 5.72% / 421,404 | 12.07% / 889,602 | 17.79% / 1,311,006 | 9.73% / 716,786 | 7,370,426 |
| Jan. 2012 | 5.35% / 397,018 | 12.18% / 903,748 | 17.53% / 1,300,766 | 9.92% / 735,760 | 7,418,830 |
| Feb. 2012 | 4.78% / 355,092 | 11.70% / 871.870 | 16.47% / 1,226,962 | 9.73% / 725,002 | 7,450,480 |
| Mar. 2012 | 4.57% / 341,213 | 11.21% / 837,472 | 15.78% / 1,178,685 | 9.47% / 707,930 | 7,471,708 |
| Apr. 2012 | 4.77% / 358,174 | 11.20% / 840,803 | 15.97% / 1,198,977 | 9.42% / 707,222 | 7,507,031 |
| May 2012 | 4.93% / 372,514 | 11.29% / 852,608 | 16.23% / 1,225,222 | 9.43% / 711,612 | 7,549,730 |
| June 2012 | 5.19% / 393,894 | 11.43% / 867,959 | 16.61% / 1,261,853 | 9.48% / 719,984 | 7,594,689 |
| July 2012 | 5.04% / 384,349 | 11.48% / 874,802 | 16.52% / 1,259,151 | 9.51% / 725,074 | 7,622,873 |
| Aug. 2012 | 4.91% / 375,464 | 11.44% / 874,656 | 16.35% / 1,250,120 | 9.49% / 725,692 | 7,645,912 |
| Sept. 2012 | 5.58% / 428,351 | 11.70% / 898,590 | 17.30% / 1,326,931 | 9.62% / 738,303 | 7,671,677 |
| Oct. 2012 | 5.02% / 387,000 | 11.54% / 887,959 | 16.57% / 1,274,959 | 9.54% / 734,431 | 7.693,992 |
| Nov. 2012 | 4.95% / 382,194 | 11.53% / 888,901 | 16.48% / 1,271,095 | 9.56% / 737,251 | 7,710,077 |
| Dec. 2012 | 5.23% / 404,686 | 11.50% / 890,400 | 16.72% / 1,295,086 | 9.40% / 728,394 | 7,744,925 |
| Jan. 2013 | 5.07% / 392,536 | 11.63% / 900,852 | 16.70% / 1,293,388 | 9.58% / 741,618 | 7,744,921 |
| Feb. 2013 | 4.76% / 369,571 | 11.21% / 869,952 | 15.97% / 1,239,523 | 9.39% / 728,860 | 7,760,200 |
| Mar. 2013 | 4.52% / 351,478 | 10.68% / 829,619 | 15.21% / 1,181,097 | 9.03% / 701,628 | 7,767,181 |
| Apr. 2013 | 4.36% / 338,957 | 10.32% / 801.694 | 14.68% / 1,140,651 | 8.73% / 678,506 | 7,770.886 |
| May 2013 | 4.39% / 341,400 | 10.06% / 782,193 | 14.46% / 1,123,593 | 8.45% / 656,909 | 7,771,948 |
| June 2013 | 5.27% / 410,172 | 10.26% / 798,199 | 15.53% / 1,208,371 | 8.47% / 659,314 | 7,781,196 |
| July 2013 | 4.87% / 378,903 | 10.10% / 782,895 | 14.94% / 1,161,798 | 8.25% / 641,808 | 7,776,713 |
| Aug. 2013 | 5.05% / 393,536 | 9.98% / 776,768 | 15.03% / 1,170,304 | 8.11% / 631,502 | 7,778,157 |
| Sept. 2013 | 4.98% / 387,624 | 9.99% / 777,901 | 14.97% / 1,165,525 | 8.09% / 630,077 | 7.778,663 |
| Oct. 2013 | 4.81% / 375,530 | 9.89% / 771,215 | 14.70% / 1,146,745 | 8.02% / 625,415 | 7,801,056 |
| Nov. 2013 | 5.01% / 391,010 | 9.95% / 776,188 | 14.96% / 1,167,198 | 8.05% / 627,641 | 7,800,165 |
Sources: US Department of Housing and Urban Development, “Neighborhood Watch,” https://entp.hud.gov/sfnw/
Notes:
[1] The AEI Pinto-Oliner Mortgage Risk Index is part of AEI’s new International Center on Housing Risk. The index is available on the center’s website atwww.housingrisk.org/category/
[2] A high-risk loan has a cumulative default rate under stress of 12 or greater, a medium-risk loan has a cumulative default rate under stress of 6 or greater and less than 12, and a low-risk loan has cumulative default under stress of less than 6.
[3] John Makin, “Third Time Unlucky: Recession in 2014?” AEI Economic Outlook (July 2013), www.aei.org/outlook/economics/
[4] January–June 2013 estimates were adjusted based on data contained in exhibits 5 and 8, US Department of Housing and Urban Development, FHA Single-Family Mutual Mortgage Insurance Fund Programs, Quarterly Report to Congress FY 2013 Q3, 9 and 13.
EDITORS NOTE: Starting with the January 2014 issue, FHA Watch will become Housing Risk Watch, with FHA Watchbecoming a quarterly feature. Housing Risk will cover all facets of housing risk, with a primary focus on government-sponsored risk.
