
Shock Study: As public school funding increased student SAT scores decreased
Long-term trends in academic performance and spending are valuable tools for evaluating past education policies and informing current ones. But such data have been scarce at the state level, where the most important education policy decisions are made. State spending data exist reaching back to the 1960s, but the figures have been scattered across many different publications. State-level academic performance data are either nonexistent prior to 1990 or, as in the case of the SAT, are unrepresentative of statewide student populations.
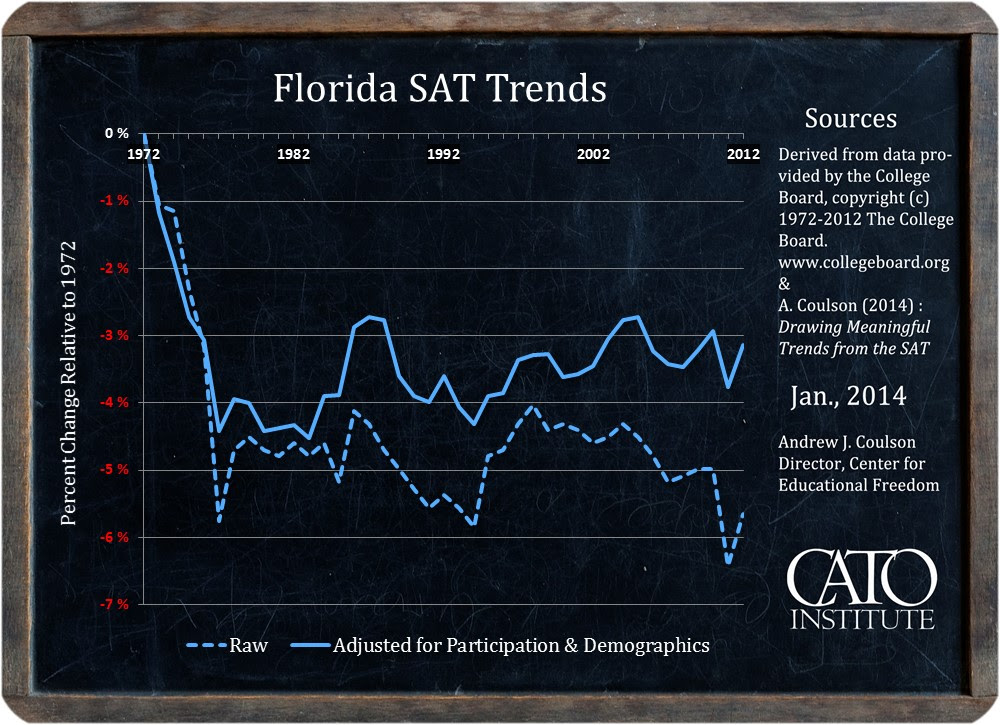
Using a time-series regression approach described in a separate publication, this CATO Institute paper adjusts state SAT score averages for factors such as participation rate and student demographics, which are known to affect outcomes, then validates the results against recent state-level National Assessment of Educational Progress (NAEP) test scores.
This CATO study produces continuous, state-representative estimated SAT score trends reaching back to 1972.
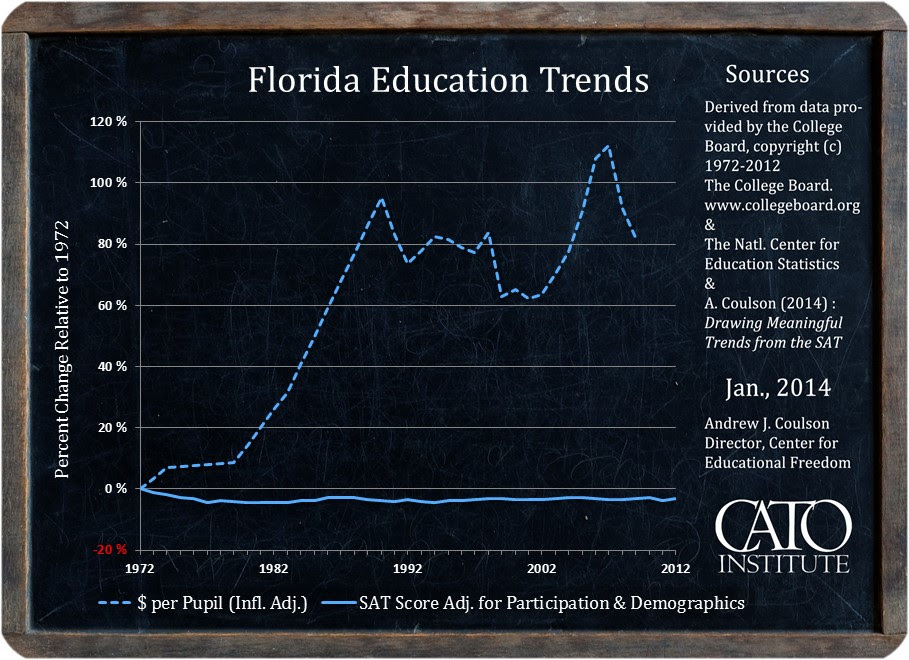
The CATO Institute presents paper charts of these trends against both inflation-adjusted per pupil spending and the raw, unadjusted SAT results, providing an unprecedented perspective on American education inputs and outcomes over the past 40 years.
The CATO study found:
In general, the findings are not encouraging.
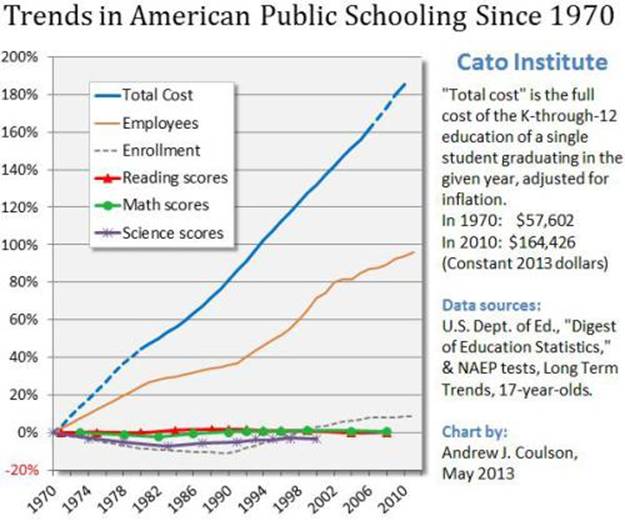
Adjusted state SAT scores have declined by an average of 3 percent. This echoes the picture of stagnating achievement among American 17-year-olds painted by the Long Term Trends portion of the National Assessment of Educational Progress, a series of tests administered to a nationally representative sample of students since 1970. That disappointing record comes despite a more-than-doubling in inflation-adjusted per pupil public-school spending over the same period (the average state spending increase was 120 percent).
Consistent with those patterns, there has been essentially no correlation between what states have spent on education and their measured academic outcomes. In other words, America’s educational productivity appears to have collapsed, at least as measured by the NAEP and the SAT.
That is remarkably unusual. In virtually every other field, productivity has risen over this period thanks to the adoption of countless technological
advances—advances that, in many cases, would seem ideally suited to facilitating learning. And yet, surrounded by this torrent of progress, education has remained anchored to the riverbed, watching the rest of the world rush past it.Not only have dramatic spending increases been unaccompanied by improvements in performance, the same is true of the occasional spending declines experienced by some states. At one time or another over the past four decades, Alaska, California, Florida, and New York all experienced multi-year periods over which real spending fell substantially (20 percent or more of their 1972 expenditure levels). And yet, none of these states experienced noticeable declines in adjusted SAT scores—either contemporaneously or lagged by a few years. Indeed, their score trends seem entirely disconnected from their rising and falling levels of spending. [Emphasis added]
Following are the state charts for Florida:
To view the results for your state go to State Education Trends
RELATED STORY: More Bad News from Government-Run Education: The Corrosive Centralization of Common Core
For a larger view click on the chart. Courtesy of CATO Institute.
