Housing’s Stunning Downfall in One Chart: Prices Have Plunged in 51 of These 60 Cities
Home Prices are Down in Every One of the Top 58 Metros According to the Latest AEI Data. But Cities in this Region Have Taken the Biggest Hit so Far.
In the Fortune article below Shawn Tully discusses recent declines in the housing market and their variability between regions with Ed Pinto, the Director of AEI’s Housing Center.
It’s official: The sudden reversal in home prices that began this spring has hit every one of America’s major metros with declines from their recent all-time peaks. What’s remarkable is the gigantic range of the pullbacks from region to region, and how the biggest losers are due to keep falling fast, while the metros that so far have taken the most modest hits should face only relatively small retreats from their pinnacles by the close of 2023.
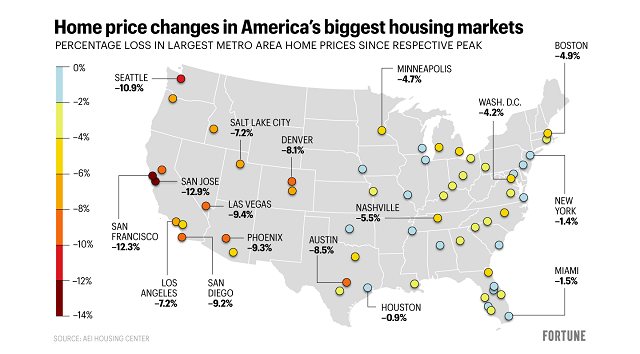
That’s the evidence from a report just issued by the American Enterprise Institute’s Housing Center. Each month, the AEI measures the total change in home prices in 58 markets from their previous summits. The new chart shows that 45 of those cities crested to cap a synchronized spiral between April and June, though a handful peaked later, including Miami and North Port in July, and Greenville, Charleston and Cincinnati in September. For the first time in October, every one of the 58 markets registered a fall from their high points, ranging from -12.9% in San Jose to -0.5% in Memphis.
The West takes the biggest pounding
The October numbers highlight a continuation of the most striking trend: the sharp pullbacks in the western cities. Indeed, of the fifteen metros showing the largest shrinkage, the metro farthest east is Austin. Posting the second steepest slide behind San Jose is San Francisco (-12.3%), followed by Seattle (-10.9%), Las Vegas (-9.4), Phoenix (-9.3%), San Diego (-9.2%), Sacramento (-8.7%), Austin (-8.5%), and Denver (-8.1%). Portland, Salt Lake City, Los Angeles, Boise and Colorado Springs have all retreated between 7.0% and 7.3% from their peaks notched just a few months ago.
These western markets—especially those in California—typically suffer from super-strict zoning laws that artificially restrict new building and hence severely limit the supply of housing. Those bottlenecks lifted prices gigantically over the past decade. From the start of 2012, Salt Lake City gained 159%, San Jose, San Francisco and San Diego between 163% and 168%, Austin 170%, Seattle 180%, and Riverside 194%. The champ was once sleepy Boise at 230%.
Boise boomed because it offered much more affordable housing than on the Golden State coasts, and hence attracted a wave of Californians who would work from anywhere in the post-COVID economy. But that mass migration has rendered its once-bargain housing far less attractive. The outflow from the likes of San Francisco and Seattle also greatly swelled prices in such formerly low-cost markets as Phoenix, Las Vegas, and Tucson. But now, a big swath of America’s western tier is pricing tens of millions of potential buyers out of the market, especially now that 30-year mortgage rates are hovering at nearly 7%, their highest level in decades. The upshot: A collapse in demand that’s sent values tumbling 7% to 13% in just a couple of months. “The places with the fastest growing prices in recent years are the ones correcting the most, and they’re all in the west,” says Ed Pinto, the director of the AEI Housing Institute.
VIEW: Home prices change since peak map.
Florida and Midwest are showing relatively small decreases
“What impresses me most is that while all markets have declined, the range of the declines is huge,” Pinto told me in a phone interview. He notes that the cities faring best are a mix that fall into two categories. The first are industrial metros in the Midwest and east that missed the boom. For example, Pittsburgh and Milwaukee gained 75% and 94% respectively since the start of 2012, less than half the increases in the hottest west coast locales. So their residents typically don’t flee in search of cheaper housing. Pittsburgh’s dropped just 3.5% from its peak, and Milwaukee’s down 1.7%. Memphis, St. Louis, Omaha, Philadelphia, Chicago and New York have all slid less than 2% of their respective high water marks. “The cities in the Midwest and Northeast are correcting the least,” says Pinto. “Their values didn’t rise nearly as much as in the western metros, so they don’t have nearly as far to fall.”
The second group encompasses sunbelt metros where prices have jumped just as sharply as on the west coast, but that are proving far more resilient than a San Jose or Seattle. The phenomenon is especially strong in the Sunshine State. Over the past ten years, the average house in the North Port market that includes Sarasota has waxed by 199%, while the Cape Coral homeowners gained 203%, nearly as much as Boise. Such Florida hotspots as Deltona and Orlando have registered comparable increases. Yet those metros have suffered only a fraction of the damage in the western markets. Of the group, Cape Coral had the largest fall at -3.5%, while Deltona, North Port and Orlando are down between 1.6% and 0.6%. Pinto points out that the Florida markets are still benefiting from super tailwinds, notably the exodus of buyers from the midwest and East Coast who can enjoy the sunshine while working from home, and prices that despite the big run-up, remain highly affordable versus the Western and Northeast metros. For example, the median sales prices in Q2 stood at $385,000 in Cape Coral and $400,000 in Orlando, highly attractive to families searching the ads in New York or Denver.
Where will housing prices go from here?
Pinto predicts that we’ll see a continuation of the present trajectory through the end of 2023—the West Coast markets will keep dropping rapidly, and the still relatively affordable sunbelt metros will suffer relatively small declines from their record highs. “In markets such as San Jose, San Francisco and Seattle, you could see a total decline from the spring peaks of 30%,” says Pinto. “That means another 15% or more from the decreases they’ve experienced through October.” On the other hand, he believes that the combination of continued strong population growth and affordable prices, sustained by strong levels of new construction versus the West Coast markets, will keep future total declines in the mid-single digits. “I see decreases of maybe 5% to 7% in markets such as North Port, Orlando, and many affordable Sunbelt markets,” he says.
As for the metros of the industrial Midwest and Northeast that are so far displaying only small declines, and never boomed in the first place, Pinto says that their housing values are highly dependent on the course of the overall economy. “If a recession kicks in unemployment will go up in a Memphis, Chicago or St. Louis,” he says. “Then their price declines will accelerate. But those places are still relatively affordable. If unemployment stays low, we’ll see relatively small total decreases from their peaks, along the lines of what we’ll see in the sunbelt markets benefiting from all the in-migration.”
Put simply, we’re witnessing a tale of three markets, the overpriced, extremely vulnerable West Coast from where people are fleeing, the Sunbelt that’s boomed but whose affordability provides good protection, and the Midwest and Northeast that didn’t join the joy ride, but whose fortunes will closely track the trend in employment. “I expect that the immense variability we’ve seen from region to region to continue,” Pinto concludes. The lesson from Pinto’s analysis is that we don’t have to see a steep fall everywhere where prices soared, because in many of those places, notably much of Florida and the Carolinas, homes remain a good deal for the natives and folks from the pricier regions. Keep in mind that the flexibility to live where housing’s most affordable and still keep your California or New York job has transformed the market. But in the West where the boom pushed homes beyond the reach of the broad swath of potential buyers, we’ll see jaw-dropping drops. And the already steep declines in October are just the beginning.
VIEW: Home Prices change since peak chart—chart continued
The Fortune article can also be found here.
AUTHORS
Edward J. Pinto | Shawn Tully
EDITORS NOTE: This AEI column is republished with permission. ©All rights reserved.

Leave a Reply
Want to join the discussion?Feel free to contribute!