Hamas-linked North American Islamic Trust received thousands in farm subsidies, never produced any crops

NAIT’s farm subsidies stopped in 2008 during the trial and were first received again in 2011.” That was right around the time that the Obama Administration scrubbed all mention of Islam and jihad from counterterror training materials, while collaboration with groups linked to Hamas and the Muslim Brotherhood was in full swing in numerous government agencies. So this is no surprise. It is consistent with established administration policy.

“Islamic group once tied to terror trial received thousands in farm subsidies, without growing crops,” by Emily Walker for FoxNews.com, February 1 (thanks to all who sent this in):

An Islamic organization once listed by the Justice Department as a co-conspirator in a high-profile terror case is among many groups that have received thousands in federal farm subsidies, without producing any crops.

The subsidies to the North American Islamic Trust are just a slice of the questionable payments that, as has been well documented, go to millionaires and non-farmers every year. But as Congress moves to rein in the program, these subsidies stand out considering the group’s involvement in the Holy Land Foundation case of 2008. During the trial, the group’s farm subsidies stopped, only to be reinstated after a federal judge cleared them.

Records show that since 1998, the North American Islamic Trust has received over $10,000 across 34 separate taxpayer-funded programs. NAIT’s two relatively small land plots are tax-zoned as “agricultural” — but they aren’t developed.

The group has been able to obtain farm subsidies legally without producing any crops because it is a nonprofit “charity group” landowner — so it received subsidies on top of being tax-exempt.

“Organizations with no history in agriculture are getting in on taxpayer-provided farm subsidies,” said Adam Andrzejewski, founder of the transparency database OpenTheBooks.com and former Republican candidate for governor of Illinois.

He said the NAIT’s subsidies are “probably legal,” adding: “The federal farm bill has become so large that it has nothing to do with ‘preserving the family farm’ or ‘creating a stable food supply’.”

The North American Islamic Trust’s history is complicated — as the offshoot of the Muslim Students Association and its financial arm, NAIT was founded in 1973 by Middle Eastern-born college students.The majority of NAIT’s founders were members of the Muslim Brotherhood, and the group continues to be backed by Saudi Arabia. NAIT uses Shariah-approved investing with its own company, Allied Asset Advisors, to buy and pool mosques and community centers. Former Allied Asset Advisor board member, Jamal Said, preached the most conservative forms of Islam and was specifically named as a co-conspirator in the terror-funding case.

In the Holy Land Foundation case of 2008, which prosecuted investors charged with sending money to Hamas, NAIT was named by U.S. federal prosecutors as a co-conspirator and an entity that is or was “a member of the Muslim Brotherhood” (the parent organization of Hamas).

The Holy Land Foundation’s five accused individuals were sentenced for funneling $12.4 million to the terror group, which controls the Gaza Strip and is dedicated to the destruction of Israel. NAIT never was formally charged in the case.

NAIT’s sheer size may have worked against it. An estimated one in five mosques in the United States is owned by NAIT; those properties are estimated to be worth hundreds of millions of dollars. Several of these mosques, though, have been places of worship for those convicted in terror activities.

But even before a verdict in the 2008 Holy Land Foundation case had been reached, NAIT appealed their co-conspirator status, saying that they had “suffered injuries” from a “public branding.”

In October of 2010, the Fifth Circuit Court overturned the group’s “co-conspirator” status after NAIT’s appeal and pressure from the ACLU. The Fifth Circuit Court of Appeals said “if NAIT could have been accurately characterized as a joint venture,” that “does not carry an inherently criminal connotation.”

NAIT’s farm subsidies stopped in 2008 during the trial and were first received again in 2011.

Every farm subsidy to the North American Islamic Trust has been received at the mailing address of the Islamic Center of Central Missouri Mosque, records show. The USDA lists the “farm location” as Boone County, Mo. But aerial searches of the “agricultural” properties owned by the North American Islamic Trust reveal that the plots are undeveloped, tree-dotted land combined to form just over 100 acres valued at about $59,000.

The North American Islamic Trust and the Islamic Center of Central Missouri did not reply to multiple requests for comment.

According to the USDA and OpentheBooks.com, about half of NAIT’s subsidies were “Direct Payments,” a program which costs taxpayers an annual $5 billion. By 2011, the North AmericaN Islamic Trust began obtaining subsidies under the auspice that it is a “church, charity, or non-profit organization.”…

RELATED COLUMN: Wisconsin: Christian College Drops ‘Crusaders’ Nickname Because…of Islam

Confirmed: The IRS Is Weaponized

It’s official! A senior member of Congress has publicly said what FairTax® supporters have known for years: The IRS is the political weapon of choice for the ruling elite!

During a recent speech to the Center for American Progress, Senator Charles Schumer (NY) called on the Executive Branch of government to bypass Congress and use the IRS to ensure that certain conservative leaning non-profits are “weakened” and their funding “curtailed”. Why?

According to numerous media reports, Schumer stated, “It is clear that we will not pass anything legislatively as long as the House of Representatives is in Republican control, but there are many things that can be done administratively by the IRS and other government agencies—we must redouble those efforts immediately.”

This should strike fear in every single citizen, regardless of political ideology. 

Congressman Schumer’s agenda is to silence the Republican majority. During the 70’s, President Nixon’s agenda was to silence the then Democratic majority. And therein lies the problem.

When the ruling class uses the IRS and the tax code to silence dissenting opinion and to control legislative agendas, all Americans lose their voice, regardless of political affiliation. And, when the means of silence is utilizing an agency that historically incorporates fear, intimidation and imprisonment as a means of enforcement, the slippery slope has begun.

It’s now pretty clear why the requested investigation of IRS abuses of conservative leaning non-profits is not going anywhere. And probably won’t.

It’s probably also why, during the 2013 tax season, nearly 20 million taxpayer calls for assistance will go unanswered. That’s right – at a time when the tax code has blown up to nearly 100,000 pages and the Obamacare regulations are in effect – good luck getting your or your preparer’s call answered. And if the IRS does answer the phone, National Taxpayer Advocate Nina Olson indicated they will only answer basic questions until April — after that, you are totally on your own. Gee thanks.

Are you elderly, disabled or low income and do you use the IRS to help you prepare your return? Sorry Charlie. They don’t do that anymore either and if you write asking for assistance, don’t hold your breath for a response – only about half the letters they receive are going to get a written response.

One can only assume the IRS is too busy supporting various political agenda’s to focus on their core mission, which is “as…one of the world’s most efficient tax administrators…. To provide America’s taxpayers top quality service by helping them understand and meet their tax responsibilities and enforce the law with integrity and fairness to all.”

There is an answer to this problem.  The FairTax® Plan.

It is a simple and fair solution that is before the Committee on Ways and Means awaiting a vote. Your voice is needed now more than ever. HR 25 is a fair and simple tax replacement plan that replaces the current income tax code and abolishes the IRS.

No more unanswered IRS calls or mail, or worrying about how to prepare your tax return – there are no tax returns with the FairTax Plan. Under the FairTax your federal tax is paid each and every time you purchase new goods and services – at the cash register. And with the unique FairTax “Prebate”, your essential goods and services are always tax-free.

Don’t allow your voice to be silenced by a tax code that only allows the political agenda of the day. Contact your Representatives today, tomorrow and the next day. Call their Washington office. Call their district office.

And when Members of Congress are willing to stand tall for the FairTax, like Congressman Ander Crenshaw (FL-4) who recently released this message stating his continued support for the FairTax, take time to thank them for their support.

As Winston Churchill said, “Success is not final, failure is not fatal: it is the courage to continue that counts.”

Finally, political commentator and former Washington Post editorialist Mark Shields lamented this week about the slow progress of tax reform in Congress.

How does Your State Tax Computer Software?

Joseph Henchman and Richard Borean from the Tax Foundation a hard look at how states tax computer software.
Get 45 public finance experts in a room and most will agree that a sales tax should apply to all final sales but not to business purchases, so each product is taxed once and only once. The 45 states with sales taxes do the opposite, exempting many final sales and taxing many business purchases.”

Sales tax treatment of software is the subject of this week’s Tax Foundation map. Ideally, all software purchases should be taxable to final users and exempt for business users. Instead, states tax some kinds of software and exempt others, based on whether it is customized or off-the-shelf and whether it is on CD or downloaded, all silly distinctions for tax purposes. States like Hawaii, New Mexico, South Dakota, Tennessee, and Texas are at least consistent in taxing it all. No state exempts it all, although Florida and Maryland come close. As for why Arkansas, Ohio, and South Carolina tax custom software when you buy it on a CD but exempt it when you download it, your guess is as good as ours.

We present state tax treatment of five different kinds of software: (1: triangle) pre-made “canned” software purchased in the form of tangible property like a disk or CD; (2: square) canned software downloaded directly onto a computer; (3: circle) custom software purchased on a disk or CD; (4: starburst) custom software downloaded; and (5: star) custom software customized by the user for their use.

(Click on the map to enlarge it. View previous maps here.)

State Budget Solutions’ Releases “Fourth Annual State Debt Report”

State Budget Solutions’ (SBS) fourth annual State Debt Study reveals that state governments face a combined $5.1 trillion in debt. This total equals roughly $16,178 per capita, or 33 percent of annual gross state product. Another telling way to view the problem – state debt is equal to 469% of all fiscal year state general and other fund expenditures.

Since 2010, SBS has conducted a comprehensive examination of debt facing the 50 state governments. These reports have repeatedly found trillions in combined debt that stand in stark contrast to officials’ proclamations of balanced budgets and belt-tightening. This year’s update, and those in the past, show unfunded public pension liabilities’ incredible contribution to state debt. In fact, these liabilities make up 79 percent of all state debt.

SBS’ unique and comprehensive approach to calculating state debt includes four separate components. The components are market-valued unfunded public pension liabilities, outstanding government debt, unfunded other post employment benefit (OPEB) liabilities, and outstanding unemployment trust fund loans. Together, these four factors present an all-inclusive view of state obligations not conventionally presented but that both lawmakers and taxpayers nonetheless must confront.

The table below shows each state’s total debt, along with details breaking down that debt into its four contributing components. Per capita details and state rankings can be found in tabs along the bottom. Click here to view the spreadsheet in a separate page.

California leads the pack with $778 billion in state debt, mostly as a result of the state’s $584 billion unfunded public pension liability.  New York ($388 billion), Texas ($341 billion), Illinois ($321 billion), and Ohio ($321 billion) round out the top 5 states with the largest amounts of state debt. While each figure is staggering in its own right, this perspective does seem to highlight those states with the largest populations.

A more alarming fiscal situation is revealed when state debt totals are broken down according to a series of factors that reflect the toll that eventually reducing that debt may take on citizens, the local economy, and state budgets.

The first way to break down the data is by look at the debt on a per capita basis. Using the United States Census Bureau’s 2012 population estimates, the study reveals that combined, state debt is equal to $16,178 for every resident of a U.S. state. That figure does not adequately portray the dire situation in some states, though.

In terms of per capita, Alaska’s state debt is equal to $40,714 per person, followed by Hawaii ($33,111), Connecticut ($31,298), Ohio ($27,836), and Illinois ($24,959).


Top 5 State Debt Per Capita Bottom 5 State Debt Per Capita
Alaska $40,714 Tennessee $6,358
Hawaii $33,111 Indiana $7,094
Connecticut $31,298 Wisconsin $7,863
Ohio $27,836 South Dakota $9,249
Illinois $24,959 Arizona $9,321


State debt as a percentage of gross state product is another possible measure. Across the spectrum of states, this figure varies widely. Hawaii (64 percent), Ohio (63 percent), New Mexico (62 percent), Alaska (57 percent), and Mississippi (54 percent) all face a state debt that totals more than 50 percent of their entire 2012 gross state product.


Top 5 State Debt as a Percentage of Gross State Product Bottom 5 State Debt as a Percentage of Gross State Product
Hawaii 64% Nebraska 13%
Ohio 63% Tennessee 15%
New Mexico 62% Indiana 16%
Alaska 57% Wisconsin 17%
Mississippi 54% South Dakota 18%


Over time, state debt will exact a toll on state budgets. Money once expected to fund vital services like education and healthcare will have to be redirected to debt service, increased contributions to public pension systems, and more. Based on this, it is illustrative to examine state debt as it relates to state expenditures.

The National Association of State Budget Officers’ annual State Expenditure Report compiles total state expenditures. Excluding bonds and federal funds from fiscal year 2012 expenditures in order to focus on state resources, total state debt is equal to 469 percent of state spending.

Nevada stands out with a state debt equal to 1,048 percent of its own spending. It is followed, albeit not too closely, by Ohio (742 percent), Illinois (727 percent), California (647 percent), and Georgia (633 percent).


Top 5 State Debt as a Percentage of FY2012 Spending Bottom 5 State Debt as a Percentage of FY2012 Spending
Nevada 1,048% West Virginia 141%
Ohio 742% Wisconsin 146%
Illinois 727% Nebraska 191%
California 647% Wyoming 222%
Georgia 633% North Dakota 224%


Components of Debt

SBS calculates state debt by combining four separate components. This approach marks a slight adjustment from previous years’ reports, which also included projected fiscal year budget gaps. Due to a lack of surveyed data, this figure was not factored into the current report.

State Debt Pie Chart 2013


Components of State Debt (thousands)
Unfunded Public Pension Liabilities $3,900,823,389
Outstanding Debt $618,832,092
Unfunded OPEB Liabilities $528,787,000
Unemployment Trust Fund Loans $19,921,682
Total $5,068,364,163


Unfunded public pension liabilities

The largest single amount of the states’ combined $5.07 trillion in debt comes from unfunded public pension liabilities. These total over $3.9 trillion. The following table shows the 5 states with the largest total and per capita public pension unfunded liabilities.


Top 5 Unfunded Pension Liability (thousands) Top 5 Unfunded Pension Liability Per Capita
California $583,627,395 Alaska $32,454
Ohio $287,373,800 Ohio $24,893
New York $260,075,662 Connecticut $20,726
Illinois $254,872,560 New Mexico $20,517
Texas $244,164,239 Illinois $19,796


SBS’ calculation of over $3.9 trillion in unfunded public pension liabilities is based on data originally published in September 2013 in the report “Promises Made, Promises Broken – The Betrayal of Pensioners and Taxpayers,” which relied on the most recent actuarial data available from over 250 state-administered defined benefit pension plans. That report took a market-valued approach to calculate plan funded levels by discounting liabilities according to a risk free rate. This approach reflects the nearly risk-free nature of public pension benefits. That is, once promised, the risk that they will not have to be paid is quite low.

The State Debt Report’s examination of unfunded public pension liabilities includes over $2.46 trillion in plan assets. Based on state-reported liabilities, the total funded ratio of these plans was 73 percent. However, discounting plan liabilities according to a risk-free rate of 3.225 percent, based on the 15 year Treasury yield reveals a funded ratio of just 39 percent and $3.9 trillion in unfunded obligations.

SBS has slightly modified the list of included pension plans in the State Debt Report to ensure that the plans are at least partially attributable to state government. To that end, included plans were based on Loop Capital Markets’ “Eleventh Annual Public Pension Funding Review.”

Outstanding Debt

This component is made up of bonds, leases, and other traditional aspects of government debt as listed in each states’ comprehensive annual financial report. This year’s report, which used figures from the latest available CAFR, shows a combined $620 billion in debt. That represents an increase of roughly $13 billion over the previous year’s report. The following table shows the 5 states with the largest total and per capita outstanding debt.


Top 5 Outstanding Debt (thousands) Top 5 Outstanding Debt Per Capita
California $199,680,625 Connecticut $5,246
New York $58,060,000 Hawaii $5,346
New Jersey $41,433,010 New Jersey $4,674
Texas $41,344,000 Massachusetts $3,816
Illinois $33,186,555 Washington $3,150


Unfunded Other Post Employment Benefit Liabilities

Like unfunded pension liabilities, unfunded OPEB liabilities (mainly retiree healthcare benefits) are a threat to state finances driven by a combination of promises made to an aging public employee workforce and the states’ failure to properly fund those promises. The State Debt Report includes $529 billion in unfunded OPEB liabilities as reported by Standard & Poor’s Ratings Services (S&P) in a 2013 report “U.S. State OPEB Liabilities Decline Slightly, But Vary Widely.” The following table shows the 5 states with the largest total and per capita OPEB unfunded liabilities.


Top 5 Unfunded OPEB Liability (thousands) Top 5 Unfunded OPEB Liability Per Capita
New York $66,479,000 Hawaii $8,408
California $65,210,000 New Jersey $7,206
New Jersey $63,881,000 Delaware $6,152
Texas $55,436,000 Alaska $5,533
Illinois $33,295,000 Connecticut $4,987


While S&P’s report did find a 2 percent decrease in unfunded liabilities, it remains both revealing and distressing that, according to their research, only Indiana, Utah, and Rhode Island made their full actuarially determined OPEB contributions in fiscal year 2012. Further, only seven states currently have an OPEB trust funded beyond 20 percent of liabilities.

Outstanding Unemployment Trust Fund Loans

According to the National Conference of State Legislatures (NCSL), “The Federal Unemployment Account (FUA) provides for a loan fund for state unemployment programs to ensure a continued flow of benefits during times of economic downturn.” This fund was tapped frequently and by many states during the recent economic crisis. NCSL’s reporting, based on Department of Labor data, showed that 14 states had outstanding unemployment trust fund loans as of December 3, 2013.


Top 5 Outstanding Unemployment Trust Fund Loans (thousands) Top 5 Outstanding Unemployment Trust Fund Loans Per Capita
California $9,400,383 California $247
New York $2,851,005 Indiana $206
North Carolina $1,894,163 North Carolina $194
Ohio $1,552,419 Connecticut $160
Indiana $1,343,674 New York $146


State Budget Solutions’ Fourth Annual State Debt report shows staggering and growing levels of state debt. These figures should serve as a wake up call for citizens and policymakers alike.

Sources

Outstanding unemployment trust fund loans were obtained from the National of Conference of State Legislatures as of December 3, 2013. Outstanding debt figures were compiled based on figures from each state’s respective fiscal year 2012 comprehensive annual financial report. Unfunded other post employment benefit liabilities are based on figures from Standard & Poor’s 2013 report “U.S. State OPEB Liabilities Decline Slightly, But Vary Widely.” Unfunded public pension liabilities are based on data originally reported in State Budget Solutions’ “Promises Made, Promises Broken – The Betrayal of Pensioners and Taxpayers,” although modified to include those pension plans listed in Loop Capital Markets’ “Eleventh Annual Public Pension Funding Review.” Total population figures were obtained from the United States Census Bureau’s 2012 Population Estimates, and Gross State Product figures are from the Bureau of Economic Analysis’ regional economic index for the year 2012. State expenditure figures are based on those listed in National Association of State Budget Officers’ “State Expenditure Report,” and include actual expenditures from state general and other funds for fiscal year 2012.

Read more by clicking here.

RELATED COLUMN: The New Debt Ceiling Deadline Is Going To Be Earlier Than We Thought

Sen. Ted Cruz (R-TX): Defund Obamacare, Fund Military Pensions

In an email Texas Republican Senator Ted Cruz calls again for Congress to defund Obamacare. He also calls upon his colleagues to fully fund military pensions. The Ryan-Murray budget does neither of these things.

On the Senate floor Cruz states, “This $1.1 trillion omnibus spending bill is outrageous enough, but on top of that it provides direct funding for Obamacare, which is destroying jobs, killing insurance plans, causing premiums to increase and people to lose their doctors. We should defund Obamacare and focus our tax dollars on priorities that help Americans, such as restoring full funding for military pensions for the men and women who protect us. Instead, the Senate squelched any debate over Obamacare and proceeded to pass its trillion dollar spending bill no one has even read. The fact that the Washington establishment is hailing a massive $1 trillion omnibus spending bill as a worthy achievement is exactly what’s wrong with our government today.”

[youtube]http://youtu.be/qiyH933lOxI[/youtube]

Senator Cruz notes, “This week, once again, Washington politicians failed to listen to the American people. The Senate passed a $1.1 trillion omnibus spending bill, and the Majority Leader and Senate Democrats refused to reexamine the detrimental harms many families are facing due to Obamacare. The expansion of federal power and the lawlessness promoted among Senate Democrats and the President must stop.”

“Just this year, President Obama has delayed the employer mandate by a year, without the approval of Congress. He has chosen to modify enforcement of drug crimes, without the approval of Congress. He has granted legal status to illegal immigrants, without the approval of Congress,” states Senator Cruz.

I agree with Senator Cruz when he says, “We have had enough. It is time to make D.C. listen.”

How did the FL Congressional Delegation vote on the $1.1 Trillion Omnibus Spending Bill?

It seems Congress just can’t cut spending or the debt these days. Of course, it is an election year and you would think with all the Florida Congressional delegation members up for reelection in 2014 they would be just a little bit fiscally conservative. If you believe that I have a bridge from Miami to Cuba to sell to you.

The Consolidated Appropriations Act of 2014 (H.R.3547), better known as the omnibus appropriations package, increases base discretionary spending by $24 billion in FY 2014. Heritage Action states, “The omnibus takes the country in the wrong direction, both in terms of policy and overall spending levels.”

This omnibus bill funds a Tamiami Trail Project (subject to availability of funds) and acquiring lands for Everglades restoration. The word “abortion” appears twenty-seven times in the bill. The word “sterilization” appears six times and the words “subsidy and “healthcare” eleven times each.

Sorry no tax refunds are in the bill for us Floridians.

“On top of increasing overall spending the $1.1 trillion omnibus spending bill irresponsibly increases funding for failing programs like Head Start, funds flood insurance subsidies, and pays for ineffective green energy projects. Additionally, an Obamacare funding loophole could provide subsidies to health plans that cover abortion,” notes Heritage Action.

Heritage Action reports, “Lawmakers and their constituents had less than 48 hours to read the 1,582-page bill before the House voted. On Wednesday, the House passed the $1.1 trillion spending bill, 359 to 67 (with three liberals voting no). Now the spending bill moves to the Senate, where a vote is expected this week. The omnibus takes the country in the wrong direction, both in terms of policy and overall spending levels.”

So how did the Florida Congressional delegation vote? Here are who voted YES, NO and DNV:

Voted YES on Omnibus Spending Bill:

FL 19 REP. TREY RADEL (R)
FL 1 REP. JEFF MILLER (R)
FL 15 REP. DENNIS ROSS (R)
FL 7 REP. JOHN MICA (R)
FL 3 REP. TED YOHO (R)
FL 12 REP. GUS BILIRAKIS (R)
FL 2 REP. STEVE SOUTHERLAND (R)
FL 17 REP. TOM ROONEY (R)
FL 10 REP. DANIEL WEBSTER (R)
FL 4 REP. ANDER CRENSHAW (R)
FL 25 REP. MARIO DIAZ-BALART (R)
FL 27 REP. ILEANA ROS-LEHTINEN (R)
FL 9 REP. ALAN GRAYSON (D)
FL 5 REP. CORRINE BROWN (D)
FL 14 REP. KATHY CASTOR (D)
FL 22 REP. LOIS FRANKEL (D)
FL 23 REP. DEBBIE WASSERMAN SCHULTZ (D)
FL 21 REP. TED DEUTCH (D)
FL 18 REP. PATRICK MURPHY (D)
FL 24 REP. FREDERICA WILSON (D)
FL 20 REP. ALCEE HASTINGS (D)
FL 26 REP. JOE GARCIA (D)

Voted NO on Omnibus Spending Bill:

FL 6 REP. RON DESANTIS (R)
FL 11 REP. RICHARD NUGENT (R)
FL 8 REP. BILL POSEY (R)

Did not vote (DNV) on Omnibus Spending Bill:

FL 16 REP. VERN BUCHANAN (R)

RELATED COLUMNS: 

Who Read 1,582-Page $1.1T Spending Bill? Congressman: ‘Nobody Did’

Fed Owns 64% More U.S. Government Debt Than China (+video)

China Now Owns a Record $1.317T of U.S. Government Debt

An Open Letter To Ways And Means

Welcome back to Washington and Happy New Year

As you return to the business of the House Committee on Ways and Means, you and your colleagues will, in many ways, determine the direction of our nation by the decisions you will soon make on fundamental tax reform.

You have a clear and distinct choice to make. You can continue to pander to the special interests that will forever hold you hostage to their gluttonous demands, or you can break from this insidious cycle and fully represent the will of the people who elected you.

If you choose to continue in the bondage of special interest slavery, the demands they exact will rise to levels that even you cannot imagine. Once the fatted calf becomes addicted to the feed trough, its’ appetite becomes insatiable.

Contrast this to the people who elected you who simply want to pay their fair share of taxes without the fear and intimidation of an agency that continues to be used as a political weapon.

Even the IRS’s own watchdog, Nina Olson, stated in her just published annual report, “Public trust in [IRS] fairness and impartiality was called into question because of reports the IRS subjected certain applicants for tax exempt status to greater review based on political-sounding games.”

Sadly, Olson’s only remedy is an IRS generated U.S. taxpayer Bill of Rights. By the way, didn’t you already try this in 1988 when Congress passed the first of three Taxpayer Bill of Rights?

To Olson’s suggestion, ladies and gentlemen, isn’t this a little like the fox guarding the hen house; just like the U.S. Justice Department appointing Barbara Bosserman to lead the IRS targeting investigation?

fox guards henhouse

Silly me, I am sure any individual who shelled out over $6,000 in donations to the Obama campaign will show total impartiality during a criminal probe involving conservative organizations.

The bottom line is this – the American people want a simple and fair system of taxation without all the drama, theatrics and corruption. They want the fox to leave the hen house and they want their representatives to put a stop to the longstanding reign of terror by the IRS.

The FairTax® Plan does this and more.

Reduced to its most basic terms, the FairTax eliminates taxes on wages while taxing wealth and borrowing when spent. It eliminates the income/payroll tax system and replaces it with a single rate tax on consumption.

More importantly, it is fair, simple and universal in application – no exceptions, no exclusions, and no more special interests feeding at the trough.  And, it fosters economic growth and efficiency while fully funding the government. 

You will soon have a decision to make on fundamental tax reform.

Option 1: You tinker with the current system, call it major reform and continue in the bondage of special interests.  With this option the American people continue as the losers.

Option 2: You represent the will of the people who elected you and enact HR 25, The FairTax Act, freeing them from the bondage of an out-of-control IRS and a gobbledygook tax code that is fast approaching 100,000 pages. With this option, the American people have a fair and simple tax code that also eliminates the yearly tax return nightmare that has already begun.

Which decision will you make? Perhaps you can draw inspiration from General Robert E. Lee who once said, “You have only always to do what is right. It will become easier by practice, and you enjoy in the midst of your trials the pleasure of an approving conscience.”

Your electorate awaits your decision. Remember, they too have decisions to make in November 2014.

Is Rep. Vern Buchanan (FL-16) Sugar Coating his Vote for the Ryan-Murray Budget deal?

I sent an email to Congressman Vern Buchanan (FL District 16) regarding his vote in favor of the Ryan-Murray Budget. I received a reply and decided to analyze what Rep. Buchanan said in his letter. This is important because Rep. Buchanan sits on the House Ways and Means Committee and is co-Chair of the Florida Congressional Delegation. Both are key positions in developing fiscal and spending policies at the federal level.

Here is a point by point analysis of Rep. Buchanan’s reply using a variety of resources including the Washington Post, Heritage Foundation and Breitbart:

Dear Dr. Swier:

Thank you for contacting me about the federal budget that passed the Congress last week.  Although far from perfect, this agreement is a positive step toward restoring fiscal responsibility to Washington.

ANALYSIS – RESTORING FISCAL RESPONSIBILITY: WaPO, ‘The total deal is $85 billion. About $45 billion of that replaces sequestration cuts in 2014. About $20 billion replaces sequestration cuts in 2015. About $20 billion is deficit reduction atop sequestration.” Heritage, “[T]he deal increases spending immediately while delaying deficit reduction until later and trades some spending cuts for more revenue.” Breitbart, “The Bipartisan Budget Act (BBA) of 2013 would increase the discretionary spending caps established by the 2011 Budget Control Act (BCA) by $45 billion in 2014 and $18 billion in 2015,” the opening paragraph of the analysis reads. “The $63 billion in higher spending is not offset over the BCA window of 2014–2021; during that period, the legislation increases spending by almost $25 billion, as 53% of the offsets in the BBA realized during the BCA window come from higher fees and revenues.'”

The budget reduces the deficit and cuts spending by eliminating waste, stripping corporate welfare and trimming benefits for federal employees.  And it does this all without raising taxes.

ANALYSIS – ELIMINATING WASTE, STRIPPING CORPORATE WELFARE AND TRIMMING BENEFITS OF FEDERAL EMPLOYEES: WaPO, “The new policies in the deal are split between revenue through fees — travelers will see higher prices on airline tickets and federal workers will have to contribute more to pensions — and spending cuts.” Heritage, “The budget deal ends a cost-shared partnership called the Ultra-Deepwater and Unconventional Natural Gas and Other Petroleum Resources Research Program, which researches ultra-deepwater architecture and unconventional drilling technologies. Ending the program is an important recognition that the federal government allocates billions of taxpayer dollars to activities that the private sector should be fully funding. Congress should go much further and remove all of these funding streams for all energy sources and technologies … The budget deal’s provision to improve the Pension Benefit Guaranty Corporation’s (PBGC) $36 billion deficit is a step in the right direction, but the allocation of increased premiums is misguided. The budget deal increases both the per-participant premium as well as the variable-rate premium assessed on plans’ unfunded liabilities. Increasing the per-participant premiums forces financially sound pension plans to pay for the financially unsound plans.” Breitbart, ” [T]his plan is not even really a budget since Ryan and Murray abandoned commitments to a budget conference—making the legislation actually just a spending bill.”

The agreement replaces some of the arbitrary cuts under sequestration with more targeted spending reductions, while achieving deficit reduction greater than under current law.  The budget also preserved 92 percent of the original spending cuts required under sequestration.

Specifically, the budget deal includes some of the following provisions:

  • Reduces the deficit by $23 billion without raising taxes.
  • Reduces borrowing by $85 billion through a combination of mandatory savings and increased non-tax revenue.
  • Repeals corporate welfare policies, saving taxpayers $8.1 billion.
  • Ends the special carve-out for student-loan servicers saving taxpayers $3 billion.

ANALYSIS – ACHIEVING DEFICIT REDUCTION AND INCREASING NON-TAX REVENUE: WaPo, “Spending will be $45 billion higher in 2014 than it would’ve been absent the deal. The deal replaces about half of sequestration’s cuts to defense and non-defense discretionary spending in 2014. It replaces about a fourth of them in 2015. That means most of sequestration will go into effect in both years.” Heritage, “Under Title VI section 601, the proposal calls for an increase in aviation passenger security fees. This fee increase would take the current amount from $2.50 per passenger to $5.60. Unlike the original fee, this increase is not being used to fund or improve security. Instead, the revenue collected is being proposed to replace automatic spending cuts set to begin in January. The revenue, however, will not be directly distributed to the Transportation Security Administration (TSA); instead it will be deposited annually into a general fund of the Treasury. This increase is yet another way that the Administration and Congress are using the travel industries as an open pocketbook.” Breitbart, “Much of the spending increase in this deal has been justified by increased fees and new revenue. In other words: it’s a fee increase to fuel a spending increase—rather than reducing deficits. Disappointingly, CBO’s analysis states that $47 billion out of the $85 billion in offsets occur outside the original BCA window, and the spending cut portion of those outyear offsets are of dubious validity. It is not disputable that net spending in the BCA window is increased.”

Although far from perfect, this agreement is a positive step toward restoring fiscal responsibility to Washington.

Again, thank you for contacting me.  If you want to receive congressional updates on this issue click here.

Sincerely,

Member of Congress

RELATED VIDEO:

RELATED COLUMNS:

Booze, Pole Dancing, and Luxurious Hotels: Top 10 Examples of Government Waste in 2013
The 13 Tax Increases of 2013 – Gird Your Loins, more coming in 2014!
2014 begins with $54 billion in tax hikes

Booze, Pole Dancing, and Luxurious Hotels: Top 10 Examples of Government Waste in 2013

Romina Boccia and Matthew Sabas from the Heritage Foundation have compiled the Top 10 Examples of government fraud, waste and abuse of taxpayers money.

According to Boccia and Sabas, “The latest budget deal, passed by a bipartisan majority in both the House and the Senate, suggests that Washington agrees with House Minority Leader Nancy Pelosi (D-CA) when she said that ‘the cupboard is bare. There’s no more cuts to make.’”

The cupboard, however, is overflowing with liquor, crystal glassware, and more.

Here is the Heritage Foundation’s list of the Top 10 examples of wasteful government spending this year, serving as a reminder that there is no shortage of excessive spending in Washington.

10. Outhouse in Alaska: $98,670. The Interior Department spent nearly $100,000 to install an outhouse on an Alaskan trail, which includes a single toilet with no internal plumbing.

Outhouse

9. A bus stop with heated pavement for the Washington area$1 million. A lavish bus stop with heated pavement was built in Arlington, VA, but it has failed to keep commuters warm or dry.

bus stop

8. Grant for a pole dancing performance$10,000. Utility poles, that is. The National Endowment for the Arts provided a grant to PowerUP for Austin Energy employees to perform an artsy dance with 20 utility poles, accompanied by a live orchestra.

PoleDancing

7. Pizza — from a printer$124,995. NASA gave a six-figure grant to a company that aspires to make pizza from a 3-D printer.

pizza

6. Study to find out if couples are happier when the woman calms down after argument:$335,525. “[M]arriages that were the happiest were the ones in which the wives were able to calm down quickly during marital conflict,” found a study of 81 couples funded by the National Institutes of Health.

happy couple

5. Booze and crystal for the State Department$5.4 million. The State Department went on a bender the week before the government shutdown, purchasing $5 million of “exquisite”crystal glassware to presumably drink the $400,000 in booze they purchased in 2013.

booze

4. Monitoring depression on Twitter$82,000. The National Institutes of Health is funding a study “to use Twitter for surveillance on depressed people,” according to the Free Beacon.

Social Network - Twitter

3. Seven-figure stack of rocks at the London Embassy$1 million. The American Embassy in London will be receiving a granite sculpture from an artist “whose work resembles stacked piles of paving stones,” according to the Daily Mail.

stones

2. Artwork for Veterans Affairs offices$562,000. The Department of Veterans Affairs went on a spending spree during “use it or lose it” season, purchasing over half a million in artwork and millions in furniture in a single week.

furniture

1. Government employee trip to luxury hotel in the Caribbeanpriceless. Federal employees took a taxpayer-funded trip to the Buccaneer Hotel in St. Croix—the same hotel made famous on TV’s “The Bachelor.” The bill was divided among a number of agencies, making a final tally difficult to come by.

Scenes Of St. Croix

Honorable Mention

A Super Bowl champion Obamacare campaign: $130,000. The Baltimore Ravens were paid $130,000 in taxpayer money to sponsor the Affordable Care Act.

President Barack Obama honors the Ravens

An overwhelming, bipartisan majority of Americans thinks that Congress can find more ways to cut government spending, and there are numerous programs of questionable value that Congress should eliminate.

America did not end up $17 trillion in debt overnight. Congressional refusal to cut spending and prioritize taxpayer money more appropriately year after year got the nation to this point. Congress will have another opportunity before January 15, when considering the 2014 spending bill, to do better. Fiscal restraint is long overdue.

For other examples of government waste, see Heritage’s 2013 edition of Federal Spending by the Numbers and Senator Tom Coburn’s 2013 Wastebook.

An Open Letter to Congressman Paul Ryan

chuck wooten

Chuck Wooten, Chief Master Sergeant, USAF (Ret.)

Dear Congressman Paul Ryan and to every single GOP Congressman/Senator that voted for the budget bill just signed by President Obama,

Please note that this request by you for a cash donation from me is extremely unfortunate and very ill-timed. You see sir, I am one of the military retirees your “bipartisan” budget just impacted. You and every Republican (both in the House and Senate that voted to pass this travesty betrayed and broke trust with me and everyone like me. You may not know us by name, but we’re the people, Congressman, who answered our Nation’s call, some of us at a very early age to willingly serve YOU and others LIKE YOU so you could safely attend college and pursue your personal ambitions without fear of harm.

You might also want to note that for at least 20 years, my brothers-in-arms answered that call of duty EVERY SINGLE DAY, without fail, without complaint, without enough money to sustain our loved ones we had to leave behind while we DID OUR JOB in every corner of the Earth. And for that service, we were given absolute assurance our so-called retirement benefits would be protected by law. The very law you shattered in your zeal to impress your Democratic cohorts in your back room deal–with the enemy.

Yes, I said it. The liberal Democrats are an enemy to the American people and our Nation. Your lack of judgement and eagerness to compromise on the backs of us who protected you is sickening. Congressman, you and every Republican that voted for injuring military retirees have engaged in a complicit, sordid affair with the Democrats who’s objective has always been to dismantle the military. By climbing into their bed on this issue, you have confirmed you are absolutely no better than they and have proven it with your vote.

Congressman Ryan, the audacity which you display is noteworthy, but to unceremoniously snatch earned money from a small group that has added so much more value than the paltry $6B you looked to “save” (which is all smoke and mirrors and you know it), is reprehensible and insulting.

We have, despite the hardships, meager salaries and harsh conditions, have performed with honor and excellence…in silence, which is something most members of Congress have no idea about doing. Our job approval was, is and always be better than yours. We knew our mission and we got it done, then handed it off to a new generation in better shape than we found it.

Your ability to look us in the eye, take money from us (apparently there was ZERO, other source of waste within the federal government that you could have recovered this money from…right, got it), while simultaneously holding your hand out to beg (with passion) for our cash is stunning. Your actions have proven you do not have the tremendous intellect you’ve sold the American people on. I say, with all seriousness, Congressman, what you lack in intellect and spinal rigidity, you make up for in cajones.

I hope you and your cowardly, Republican “colleagues” hear a message from me loud and clear. You will NEVER receive another cent of financial support from me. Further, if you happen to be at a Capitol Hill dinner or at a K Street cocktail party with RNC Chair Reince Priebus, Rep. Ron Barber, Sen. Jeff Flake or Sen. John McCain, I would be honored if you communicate with them that I am launching an effort to ensure NONE of you traitorous “representatives of the people” ever receive another vote from a military retiree. Remove me from your contact lists.

Chuck Wooten,
Chief Master Sergeant, USAF (Ret.)

Authors Note: While I did not write this letter, I second it. Please feel free my military friends to add your name to this letter Chuck Wooten and send it out across your network.

Florida Congressional Delegation votes to defund our Veterans and fund Illegals

Heritage Action for America reports, “The budget agreement crafted by Rep. Paul Ryan (R-WI) and Sen. Patty Murray (D-WA) would lift the discretionary spending caps to $1.012 trillion in 2014 and $1.014 trillion in 2015 and increase revenues through an assortment of tax increases (which are labeled fees) in exchange for promises of future spending reductions.”

The deal represents an immediate increase in federal spending — $63 billion over the next two years. This is a significant achievement for President Obama, who believes that government spending is a panacea to America’s economic woes.The deal also relies upon promises of future cuts to offset the immediate spending increases. Amazingly, negotiators moved roughly a third of the deficit reduction ($28 billion in cuts) to 2022. By increasing spending, increasing fees and offering up another round of promises waiting to be broken, the deal represents a step backwards.

Newsmax reports, “Sen. Kelly Ayotte, R-N.H., is urging both parties to work through Christmas if necessary to keep the bipartisan budget deal from harming disabled veterans. Ayotte has filed two amendments she says would pay for the $6 billion lost by restoring cuts to veterans’ retirement benefits, but she said Tuesday on CNN’s ‘The Lead with Jake Tapper’ that her amendments will not be taken up by the Democrat-controlled Senate.” These amendments failed.

The Florida Congressional Delegation is co-Chaired by Rep. Vern Buchanan (R FL-16) and Alcee Hastings (D FL-20). The following is how members of the Florida Congressional Delegation voted for the Ryan-Murray Budget:

Republican members voting YES:

FL 1 REP. JEFF MILLER
FL 15 REP. DENNIS ROSS
FL 7 REP. JOHN MICA
FL 3 REP. TED YOHO
FL 12 REP. GUS BILIRAKIS
FL 2 REP. STEVE SOUTHERLAND
FL 17 REP. TOM ROONEY
FL 16 REP. VERN BUCHANAN
FL 4 REP. ANDER CRENSHAW
FL 27 REP. ILEANA ROS-LEHTINEN

Democrat members voting YES:

FL 9 REP. ALAN GRAYSON
FL 14 REP. KATHY CASTOR
FL 23 REP. DEBBIE WASSERMAN SCHULTZ
FL 21 REP. TED DEUTCH
FL 18 REP. PATRICK MURPHY
FL 24 REP. FREDERICA WILSON
FL 20 REP. ALCEE HASTINGS
FL 26 REP. JOE GARCIA

The following Florida Delegation members voted NO:

FL 6 REP. RON DESANTIS (R)
FL 11 REP. RICHARD NUGENT (R)
FL 8 REP. BILL POSEY (R)
FL 10 REP. DANIEL WEBSTER (R)
FL 22 REP. LOIS FRANKEL (D)

The following Florida Delegation members DID NOT VOTE:

FL 19 REP. TREY RADEL
FL 5 REP. CORRINE BROWN

FL Senator Rubio and Rep. Buchanan get Special Obamacare Subsidy

(CNSNews.com) – Under Obamacare — as it is being implemented under a regulation issued by the White House Office of Personnel Management (OPM) — a middle-aged member of Congress who earns an annual salary of $174,000 from the taxpayers, and who has a wife and children, will get a $10,000 subsidy from the taxpayers (over and above his $174,000 salary) to buy a health insurance plan that a regular citizen making almost $80,000 less than the congressman will not get.

The Affordable Care Act (ACA), popularly known as Obamacare, included language mandating that members of Congress and their staff buy their now-mandated health insurance plans through a government exchange.

The laws says: “Notwithstanding any other provision of law, after the effective date of this subtitle, the only health plans that the Federal Government may make available to Members of Congress and congressional staff with respect to their service as a Member of Congress or congressional staff shall be health plans that are—(I) created under this Act (or an amendment made by this Act); or (II) offered through an Exchange established under this Act (or an amendment made by this Act).” (See Section 1312(d) of the law)

Americans in the private sector who buy health insurance through the Obamacare exchanges only get a federal subsidy (a tax credit) if their income/family situation is below 400% of poverty, the ceiling for which is $94,200 for a family of four.

If they surpass that 400% level, then no subsidy.  Theoretically, a family bringing in $174,000, like a member of Congress, would have to have 12 children dependents to even be eligible for a subsidy under the Obamacare rules. (See Federal Poverty Guidelines.pdf )

Read more.

Based on this ruling Florida Senator Marco Rubio and many of the Florida Congressional delegation members, led by Rep. Vern Buchanan and Alcee Hastings, will receive  this subsidy.

Large Gap Exists Between Lifetime Social Security and Medicare Benefits and Taxes

The American Enterprise Institute’s Jim Pethokoukis found this great chart (below) by the Urban Institute’s Eugene Steuerl. It shows the lifetime Social Security and Medicare taxes and benefits.

“Couples retiring today, with roughly the average earnings of workers in general, as well as average life expectancies, still receive about $1 million in lifetime benefits,” writes Steuerle. However, they will only pay $747,000 in Social Security and Medicare taxes over that lifespan.

The gap between taxes and benefits has always been large. However, more people retiring and living longer–both great things–is causing the financial situation of both programs to get worse. As it stands now, Social Security won’t be able to pay full benefits starting in 2033, and Medicare Part A, which pays for hospital services, will go bankrupt in 13 years.

These programs must be reformed or the country will have to endure painful benefit cuts, crushing taxes, or both.

As U.S. Chamber Executive Vice President Bruce Josten said in June, “We need to make the responsible common-sense choices now, even if they are hard, to guarantee the promise of these programs to the next generation.”

Learn more at the U.S. Chamber’s “Ten Truths About America’s Entitlement Programs.”

FHA Watch: 87% of FHA’s October home purchase loans were High Risk

For the fifth year in a row, the FHA has violated federal law by failing to meet its minimum capital standard of 2 percent—equal to about $22 billion on its $1.1 trillion book of insurance in force. The 2013 Actuarial Study found that the FHA had an economic net worth of −$8 billion, up from −$13.5 billion last year but still $30 billion short of the 2 percent statutory standard. This projection assumes moderate house price appreciation averaging 3–3.5 percent over the next 28 years and that a recession is unlikely over the next few years.

Under this rosy scenario, it is no surprise that each new book of business the FHA adds looks profitable. It is also no surprise it has had to revise the expected cumulative claim rates for the 2009-2012 vintages substantially upward from last year’s estimates (for example, 2009 was raised from 13.25 percent to 15.44 percent).

Under the new AEI Mortgage Risk Index, the FHA’s home purchase loans are almost exclusively high risk (87 percent) with 13 percent being medium risk and 0.3 percent being low risk. From 1935 to 1955, nearly 100 percent of FHA loans would have qualified as low risk. The preponderance of high-risk loans today helps explain why the FHA’s delinquency rate remains stubbornly high at 15 percent and its private GAAP net worth has improved only modestly, from −$27 billion in September 2012 to −$25 billion this month. These are not indicators of a financial institution on the road to recovery.

Consider that the current economic expansion is 54 months old, about on par with the World War II standard of 58 months. Given that the standard deviation of postwar expansions is 33.4 months, a recession sometime in the next couple of years is likely. At the same time, unemployment is at 7 percent, an unusually high rate this far along in an expansion. Since the unemployment rate generally rises by about two percentage points in a recession, a rate of 8.5–9 percent might be expected if the United States does enter a new recession.

The threat the FHA poses is demonstrated by the alternate scenarios contained in the actuarial study. For example, it has a −$23 billion economic value today under the 10th-worst scenario, one that likely equates to the impact of a near-term recession. This $15 billion decline in value compared to the baseline case is nearly enough to wipe out the FHA’s minimum statutory capital requirement of 2 percent or $22 billion.

Bottom line—if the economy catches a cold, the FHA gets pneumonia. It is time Congress and the FHA faced facts: the FHA poses great risks to the taxpayer and places most of its insured home buyers into high-risk loans.

Spotlight on Best Price Execution

Planned GSE Guarantee Fee Increase Adds to Ginnie Agency Price Advantage over Fannie

Table 1 demonstrates the pricing advantages the Ginnie/FHA, Ginnie/US Department of Agriculture (USDA), and Ginnie/Veterans Affairs (VA) divisions have over Fannie Mae. FHA, VA, and USDA pricing advantages have increased by about $500 compared to last month because of a 14-basis-point guarantee fee on Fannie loans announced on December 9, 2013.

Table 1. Best Price Execution (Ginnie pricing advantages in bold)

Source: Adapted from JPMorgan’s 2012 Securitized Products Outlook, November 23, 2011, 18.

Note: Mortgage-backed securities (MBS) pricing from MBS Live, published by Mortgage News Daily. Comparison based on MBS pricing as of December 14, 2013. On that date, a Ginnie 30-year MBS with a coupon of 4.0 percent had a price of 104.25, and a Fannie 30-year MBS with the same 4.0 percent coupon had a price of 103.31. These prices were then adjusted based on the present value (where necessary) of applicable borrower-paid credit fees, mortgage insurance premiums, and the value of the base servicing fee. Fannie’s guarantee fee was increased by 10 basis points effective April 2012, as mandated by Congress, by 10 basis points again as announced on August 31, 2012, by the Federal Housing Finance Agency, and by 14 basis points as announced on December 9, 2013, by the Federal Housing Finance Agency All publicly announced FHA premium increases are included. USDA and VA premiums are unchanged. FHA, USDA, and VA pricing includes loan-level pricing adjustments made by Carrington Wholesale Services.

On the whole, the five divisions of the Government Mortgage Complex (along with Freddie Mac) have substantial pricing and underwriting advantages over the private sector. The result is that the Government Mortgage Complex’s share of the entire first-mortgage market continues to be at about 85 percent.

Spotlight on Insolvency

FHA’s Private GAAP-Estimated Net Worth Declines to Lowest Level in Nine Months

This month, the FHA’s private GAAP-estimated net worth deteriorated by slightly over $1 billion. The estimate for November of the FHA’s GAAP net worth is –$24.92 billion, down from –$23.77 billion in October 2013 (revised), up from –$27.39 billion in September 2012 (revised), and down from –$20.87 billion in September 2011. The capital shortfall stands at $45 billion (using a 2 percent capital ratio) and $52 billion (using a 4 percent capital ratio adjusted to 2.7 percent based on expected recoveries). The Denial Dial was reset to −2.27 percent.

Please see the notes to table A1 for a detailed explanation, including comprehensive adjustments made based the GAO analysis described here.[4]

Spotlight on Delinquency

FHA watch december table

All Rates Experience Moderate Increases from October to November

In November, 14.96 percent of all FHA loans were delinquent, up from 14.70 percent in October 2013 and down from 16.48 percent in November 2012. The FHA’s overall delinquency rate is stubbornly high, notwithstanding the declining unemployment rate, the multiyear addition of what it describes as lower-risk loans to its insurance book, and the sale in 2013 of a substantial number of delinquent notes.

Most of the increase was due to the 30-day delinquency rate increasing from 4.81 percent in October to 5.01 percent in November.

The serious delinquency rate increased modestly to 8.05 percent from 8.02 percent in October 2013 and decreased from 9.56 percent in November 2012.

For the monthly data tabulation, see table A2 in the appendix.

Appendix: Historical Data Tables

Table A1. Insolvency Watch ($ Billions)

Notes: Table A1 has been revised based on FHA’s FY2013 Actuarial Review excluding HECMs (Forward Mortgage Program), http://portal.hud.gov/hudportal/HUD?src=/program_offices/housing/rmra/oe/rpts/actr/actrmenu. Table A1estimates the FHA’s current net worth and capital shortfall under accounting rules applicable to a private mortgage insurer (PMI) such as Genworth. Estimates are based on the FHA’s delinquent loans, risk exposure, capital resources, and capital ratio under both the 2 percent statutory requirement for the FHA and the 4 percent of risk-in-force requirement applicable to a PMI. The 4 percent requirement has been adjusted to 2.7 percent based on FHA experiencing an average 30–35 percent recovery against its 100 percent claim payment. As of September 30, 2012, the FHA reported to the Government Accountability Office that its estimated transition-to-claim rate for 90-plus-day delinquencies was 71 percent. As of September 30, 2013, Genworth had loss reserves equaling 23 percent of its risk-in-force on 60–119-days-delinquent loans. This was adjusted to 20 percent for 60–89-days-delinquent loans. See GAO, “Applicability of Industry [GAAP] Requirements Is Limited, but Certain Features Could Enhance Oversight,” September 2013, footnotes 42 and 44,http://gao.gov/products/GAO-13-722; and Genworth, Quarterly Financial Supplements, Delinquency Metrics-US Mortgage Insurance Segment, 44,http://phx.corporate-ir.net/phoenix.zhtml?c=175970&p=irol-quarterlyreports

(accessed October 29, 2013).

*The FHA’s negative cash flow was $994 million per month during Q3 of FY 2013. See exhibit 10, US Department of Housing and Urban Development, FHA Single-Family Mutual Mortgage Insurance Fund Programs, Quarterly Report to Congress, 13. The FHA raised its upfront premium from 1 to 1.75 percent (excluding streamline refinances) effective for case numbers assigned on or after April 9, 2012. Since under private GAAP accounting this amount would not be taken into income immediately, it will be accounted for in the “Estimated liability for excess upfront premiums beyond GAAP allowance.” The amount of this liability was estimated at $9.60 billion as of September 30, 2013.

**Outstanding balance of loans 60-days-plus delinquent based on loan counts on applicable date times average loan balance for loans going to claim of $126,524. Reserve levels have been calculated based on termination and claim loss experience as reported in the report series entitled “Quarterly Report to Congress on the Financial Status of the MMI Fund,” FY 2013 Q3, exhibit 5, http://portal.hud.gov/hudportal/HUD?src=/program_offices/housing/rmra/oe/rpts/rtc/fhartcqtrly (accessed September 18, 2013).

***Total based on the FHA’s total amortized risk-in-force net of loans covered by loan loss reserve.

Table A2. National Delinquency Watch


End Date
30-Days Delinquency Rate and Number of Loans 60-Days-Plus Delinquency Rate and Number of Loans 30-Days-Plus Delinquency Rate and Number of Loans Serious Delinquency Total Loans
Jan. 2011 N/A N/A N/A 8.9% / 612,443 6,882,984
Mar. 2011 N/A N/A N/A 8.3% / 580,480 6,983,893
June 2011 5.79% / 411,258 10.55% / 749,204 16.62% / 1,160,462 8.34% / 592,366 7,103,531
Sept. 2011 5.70% / 413,834 11.08% / 803,899 16.78% / 1,217,733 8.77% / 636,778 7,258,328
Dec. 2011 5.72% / 421,404 12.07% / 889,602 17.79% / 1,311,006 9.73% / 716,786 7,370,426
Jan. 2012 5.35% / 397,018 12.18% / 903,748 17.53% / 1,300,766 9.92% / 735,760 7,418,830
Feb. 2012 4.78% / 355,092 11.70% / 871.870 16.47% / 1,226,962 9.73% / 725,002 7,450,480
Mar. 2012 4.57% / 341,213 11.21% / 837,472 15.78% / 1,178,685 9.47% / 707,930 7,471,708
Apr. 2012 4.77% / 358,174 11.20% / 840,803 15.97% / 1,198,977 9.42% / 707,222 7,507,031
May 2012 4.93% / 372,514 11.29% / 852,608 16.23% / 1,225,222 9.43% / 711,612 7,549,730
June 2012 5.19% / 393,894 11.43% / 867,959 16.61% / 1,261,853 9.48% / 719,984 7,594,689
July 2012 5.04% / 384,349 11.48% / 874,802 16.52% / 1,259,151 9.51% / 725,074 7,622,873
Aug. 2012 4.91% / 375,464 11.44% / 874,656 16.35% / 1,250,120 9.49% / 725,692 7,645,912
Sept. 2012 5.58% / 428,351 11.70% / 898,590 17.30% / 1,326,931 9.62% / 738,303 7,671,677
Oct. 2012 5.02% / 387,000 11.54% / 887,959 16.57% / 1,274,959 9.54% / 734,431 7.693,992
Nov. 2012 4.95% / 382,194 11.53% / 888,901 16.48% / 1,271,095 9.56% / 737,251 7,710,077
Dec. 2012 5.23% / 404,686 11.50% / 890,400 16.72% / 1,295,086 9.40% / 728,394 7,744,925
Jan. 2013 5.07% / 392,536 11.63% / 900,852 16.70% / 1,293,388 9.58% / 741,618 7,744,921
Feb. 2013 4.76% / 369,571 11.21% / 869,952 15.97% / 1,239,523 9.39% / 728,860 7,760,200
Mar. 2013 4.52% / 351,478 10.68% / 829,619 15.21% / 1,181,097 9.03% / 701,628 7,767,181
Apr. 2013 4.36% / 338,957 10.32% / 801.694 14.68% / 1,140,651 8.73% / 678,506 7,770.886
May 2013 4.39% / 341,400 10.06% / 782,193 14.46% / 1,123,593 8.45% / 656,909 7,771,948
June 2013 5.27% / 410,172 10.26% / 798,199 15.53% / 1,208,371 8.47% / 659,314 7,781,196
July 2013 4.87% / 378,903 10.10% / 782,895 14.94% / 1,161,798 8.25% / 641,808 7,776,713
Aug. 2013 5.05% / 393,536 9.98% / 776,768 15.03% / 1,170,304 8.11% / 631,502 7,778,157
Sept. 2013 4.98% / 387,624 9.99% / 777,901 14.97% / 1,165,525 8.09% / 630,077 7.778,663
Oct. 2013 4.81% / 375,530 9.89% / 771,215 14.70% / 1,146,745 8.02% / 625,415 7,801,056
Nov. 2013 5.01% / 391,010 9.95% / 776,188 14.96% / 1,167,198 8.05% / 627,641 7,800,165


Sources: US Department of Housing and Urban Development, “Neighborhood Watch,” https://entp.hud.gov/sfnw/public (Servicing download, Excel; accessed December 14, 2013) and US Department of Housing and Urban Development, “FHA Outlook,” http://portal.hud.gov/hudportal/HUD?src=/program_offices/housing/rmra/oe/rpts/ooe/olmenu (accessed October 21, 2012). Rates not seasonally adjusted. Serious delinquency includes 90-days-plus delinquency and loans in bankruptcy or foreclosure.

Notes:

[1] The AEI Pinto-Oliner Mortgage Risk Index is part of AEI’s new International Center on Housing Risk. The index is available on the center’s website atwww.housingrisk.org/category/mortgage-risk/.

[2] A high-risk loan has a cumulative default rate under stress of 12 or greater, a medium-risk loan has a cumulative default rate under stress of 6 or greater and less than 12, and a low-risk loan has cumulative default under stress of less than 6.

[3] John Makin, “Third Time Unlucky: Recession in 2014?” AEI Economic Outlook (July 2013), www.aei.org/outlook/economics/monetary-policy/third-time-unlucky-recession-in-2014/.

[4] January–June 2013 estimates were adjusted based on data contained in exhibits 5 and 8, US Department of Housing and Urban Development, FHA Single-Family Mutual Mortgage Insurance Fund Programs, Quarterly Report to Congress FY 2013 Q3, 9 and 13.

EDITORS NOTE: Starting with the January 2014 issue, FHA Watch will become Housing Risk Watch, with FHA Watchbecoming a quarterly feature. Housing Risk will cover all facets of housing risk, with a primary focus on government-sponsored risk.

83 Unbelievable Numbers From 2013

Fed Up USA posted 83 numbers that they call “almost too crazy to believe”. Thanks to Fed Up USA for their work in compiling this end of year list of things you can believe or not.

During 2013, America continued to steadily march down a self-destructive path toward oblivion.  As a society, our debt levels are completely and totally out of control.  Our financial system has been transformed into the largest casino on the entire planet and our big banks are behaving even more recklessly than they did just before the last financial crisis.  We continue to see thousands of businesses and millions of jobs get shipped out of the United States, and the middle class is being absolutely eviscerated.  Due to the lack of decent jobs, poverty is absolutely exploding.  Government dependence is at an all-time high and crime is rising.  Evidence of social and moral decay is seemingly everywhere, and our government appears to be going insane.  If we are going to have any hope of solving these problems, the American people need to take a long, hard look in the mirror and finally admit how bad things have actually become.  If we all just blindly have faith that “everything is going to be okay”, the consequences of decades of incredibly foolish decisions are going to absolutely blindside us and we will be absolutely devastated by the great crisis that is rapidly approaching.  The United States is in a massive amount of trouble, and it is time that we all started facing the truth.  The following are 83 numbers from 2013 that are almost too crazy to believe…

#1 Most people that hear this statistic do not believe that it is actually true, but right now an all-time record 102 million working age Americans do not have a job.  That number has risen by about 27 million since the year 2000.

#2 Because of the lack of jobs, poverty is spreading like wildfire in the United States.  According to the most recent numbers from the U.S. Census Bureau, an all-time record 49.2 percent of all Americans are receiving benefits from at least one government program each month.

#3 As society breaks down, the government feels a greater need than ever before to watch, monitor and track the population.  For example, every single day the NSA intercepts and permanently stores close to 2 billion emails and phone calls in addition to a whole host of other data.

#4 The Bank for International Settlements says that total public and private debt levels around the globe are now 30 percent higher than they were back during the financial crisis of 2008.

#5 According to a recent World Bank report, private domestic debt in China has grown from 9 trillion dollars in 2008 to 23 trillion dollars today.

#6 In 1985, there were more than 18,000 banks in the United States.  Today, there are only 6,891 left.

#7 The six largest banks in the United States (JPMorgan Chase, Bank of America, Citigroup, Wells Fargo, Goldman Sachs and Morgan Stanley) have collectively gotten 37 percent larger over the past five years.

#8 The U.S. banking system has 14.4 trillion dollars in total assets.  The six largest banks now account for 67 percent of those assets and all of the other banks account for only 33 percent of those assets.

#9 JPMorgan Chase is roughly the size of the entire British economy.

#10 The five largest banks now account for 42 percent of all loans in the United States.

#11 Right now, four of the “too big to fail” banks each have total exposure to derivatives that is well in excess of 40 trillion dollars.

#12 The total exposure that Goldman Sachs has to derivatives contracts is more than 381 times greater than their total assets.

#13 According to the Bank for International Settlements, the global financial system has a total of 441 trillion dollars worth of exposure to interest rate derivatives.

#14 Through the end of November, approximately 365,000 Americans had signed up for Obamacare but approximately 4 million Americanshad already lost their current health insurance policies because of Obamacare.

#15 It is being projected that up to 100 million more Americans could have their health insurance policies canceled by the time Obamacare is fully rolled out.

#16 At this point, 82.4 million Americans live in a home where at least one person is enrolled in the Medicaid program.

#17 It is has been estimated that Obamacare will add 21 million more Americans to the Medicaid rolls.

#18 It is being projected that health insurance premiums for healthy 30-year-old men will rise by an average of 260 percent under Obamacare.

#19 One couple down in Texas received a letter from their health insurance company that informed them that they were being hit with a 539 percent rate increase because of Obamacare.

#20 Back in 1999, 64.1 percent of all Americans were covered by employment-based health insurance.  Today, only 54.9 percent of all Americans are covered by employment-based health insurance.

#21 The U.S. government has spent an astounding 3.7 trillion dollars on welfare programs over the past five years.

#22 Incredibly, 74 percent of all the wealth in the United States is owned by the wealthiest 10 percent of all Americans.

#23 According to Consumer Reports, the number of children in the United States taking antipsychotic drugs has nearly tripled over the past 15 years.

#24 The marriage rate in the United States has fallen to an all-time low.  Right now it is sitting at a yearly rate of just 6.8 marriages per 1000 people.

#25 According to a shocking new study, the average American that turned 65 this year will receive $327,500 more in federal benefits than they paid in taxes over the course of their lifetimes.

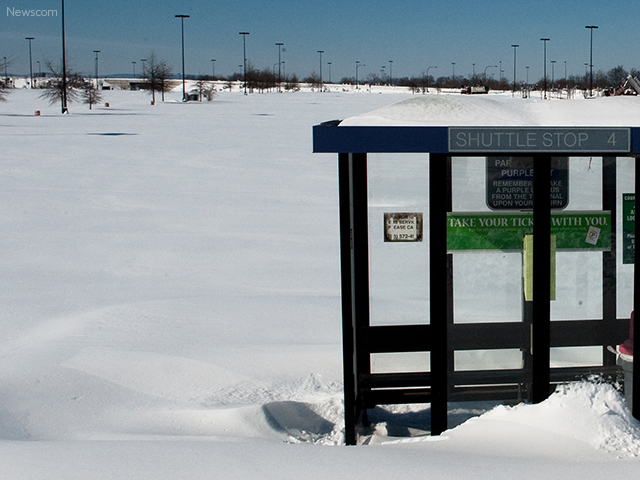
#26 In just one week in December, a combined total of more than 2000 new cold temperature and snowfall records were set in the United States.

#27 According to the U.S. Census Bureau, median household income in the United States has fallen for five years in a row.

#28 The rate of homeownership in the United States has fallen for eight years in a row.

#29 Only 47 percent of all adults in America have a full-time job at this point.

#30 The unemployment rate in the eurozone recently hit a new all-time high of 12.2 percent.

#31 If you assume that the labor force participation rate in the U.S. is at the long-term average, the unemployment rate in the United States would actually be 11.5 percent instead of 7 percent.

#32 In November 2000, 64.3 percent of all working age Americans had a job.  When Barack Obama first entered the White House, 60.6 percent of all working age Americans had a job.  Today, only 58.6 percent of all working age Americans have a job.

#33 There are 1,148,000 fewer Americans working today than there was in November 2006.  Meanwhile, our population has grown by more than 16 million people during that time frame.

#34 Only 19 percent of all Americans believe that the job market is better than it was a year ago.

#35 Just 14 percent of all Americans believe that the stock market will rise next year.

#36 According to CNBC, Pinterest is currently valued at more than 3 billion dollars even though it has never earned a profit.

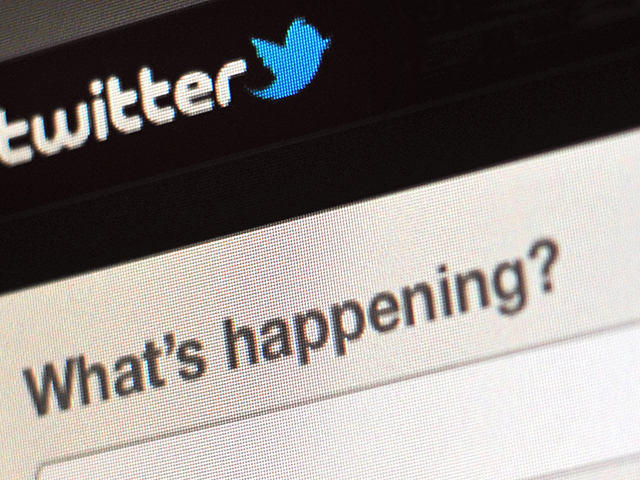
#37 Twitter is a seven-year-old company that has never made a profit.  It actually lost 64.6 million dollars last quarter.  But according to the financial markets it is currently worth about 22 billion dollars.

#38 Right now, Facebook is trading at a valuation that is equivalent to approximately 100 years of earnings, and it is currently supposedly worth about 115 billion dollars.

#39 Total consumer credit has risen by a whopping 22 percent over the past three years.

#40 Student loans are up by an astounding 61 percent over the past three years.

#41 At this moment, there are 6 million Americans in the 16 to 24-year-old age group that are neither in school or working.

#42 The “inactivity rate” for men in their prime working years (25 to 54) has just hit a brand new all-time record high.

#43 It is hard to believe, but in America today one out of every ten jobs is now filled by a temp agency.

#44 Middle-wage jobs accounted for 60 percent of the jobs lost during the last recession, but they have accounted for only 22 percent of the jobs created since then.

#45 According to the Social Security Administration, 40 percent of all U.S. workers make less than $20,000 a year.

#46 Approximately one out of every four part-time workers in America is living below the poverty line.

#47 After accounting for inflation, 40 percent of all U.S. workers are making less than what a full-time minimum wage worker made back in 1968.

#48 When Barack Obama took office, the average duration of unemployment in this country was 19.8 weeks.  Today, it is 37.2 weeks.

#49 Investors pulled an astounding 72 billion dollars out of bond mutual funds in 2013.  It was the worst year for bond funds ever.

#50 Small business is rapidly dying in America.  At this point, only about 7 percent of all non-farm workers in the United States are self-employed.  That is an all-time record low.

#51 The six heirs of Wal-Mart founder Sam Walton have as much wealth as the bottom one-third of all Americans combined.

#52 Once January 1st hits, it will officially be illegal to manufacture or import traditional incandescent light bulbs in the United States.  It is being projected that millions of Americans will attempt to stock up on the old light bulbs before they are totally gone from store shelves.

#53 The Japanese government has estimated that approximately 300 tons of highly radioactive water is being released into the Pacific Ocean from the destroyed Fukushima nuclear facility every single day.

#54 Back in 1967, the U.S. military had more than 31,000 strategic nuclear warheads.  That number is already being cut down to 1,550, and now Barack Obama wants to reduce it to only about 1,000.

#55 As you read this, 60 percent of all children in Detroit are living in poverty and there are approximately 78,000 abandoned homes in the city.

#56 Wal-Mart recently opened up two new stores in Washington D.C., and more than 23,000 people applied for just 600 positions.  That means that only about 2.6 percent of the applicants were ultimately hired.  In comparison, Harvard offers admission to 6.1 percent of their applicants.

#57 At this point, almost half of all public school students in America come from low income homes.

#58 Tragically, there are 1.2 million students that attend public schools in the United States that are homeless.  That number has risen by 72 percent since the start of the last recession.

#59 According to a Gallup poll that was recently released, 20.0 percent of all Americans did not have enough money to buy food that they or their families needed at some point over the past year.  That is just under the all-time record of 20.4 percent that was set back in November 2008.

#60 The number of Americans on food stamps has grown from 17 million in the year 2000 to more than 47 million today.

#61 Right now, one out of every five households in the United States is on food stamps.

#62 The U.S. economy loses approximately 9,000 jobs for every 1 billion dollars of goods that are imported from overseas.

#63 Back in 1950, more than 80 percent of all men in the United States had jobs.  Today, less than 65 percent of all men in the United States have jobs.

#64 According to one survey, approximately 75 percent of all American women do not have any interest in dating unemployed men.

#65 China exports 4 billion pounds of food to the United States every year.

#66 Overall, the United States has run a trade deficit of more than 8 trillion dollars with the rest of the world since 1975.

#67 The number of Americans on Social Security Disability now exceeds the entire population of Greece, and the number of Americans on food stamps now exceeds the entire population of Spain.

#68 It is being projected that the number of Americans on Social Security will rise from 57 million today to more than 100 million in 25 years.

#69 Back in 1970, the total amount of debt in the United States (government debt + business debt + consumer debt, etc.) was less than 2 trillion dollars.  Today it is over 56 trillion dollars.

#70 Back on September 30th, 2012 our national debt was sitting at a total of 16.1 trillion dollars.  Today, it is up to 17.2 trillion dollars.

#71 The U.S. government “rolled over” more than 7.5 trillion dollarsof existing debt in fiscal 2013.

#72 If the U.S. national debt was reduced to a stack of one dollar bills it would circle the earth at the equator 45 times.

#73 When Barack Obama was first elected, the U.S. debt to GDP ratio was under 70 percent.  Today, it is up to 101 percent.

#74 The U.S. national debt is on pace to more than double during the eight years of the Obama administration.  In other words, under Barack Obama the U.S. government will accumulate more debt than it did under all of the other presidents in U.S. history combined.

#75 The federal government is borrowing (stealing) roughly 100 million dollars from our children and our grandchildren every single hour of every single day.

#76 At this point, the U.S. already has more government debt per capita than Greece, Portugal, Italy, Ireland or Spain.

#77 Japan now has a debt to GDP ratio of more than 211 percent.

#78 As of December 5th, 83 volcanic eruptions had been recorded around the planet so far this year.  That is a new all-time record high.

#79 53 percent of all Americans do not have a 3 day supply of nonperishable food and water in their homes.

#80 Violent crime in the United States was up 15 percent last year.

#81 According to a very surprising survey that was recently conducted,68 percent of all Americans believe that the country is currently on the wrong track.

#82 Back in 1972, 46 percent of all Americans believed that “most people can be trusted”.  Today, only 32 percent of all Americans believe that “most people can be trusted”.

#83 According to a recent Pew Research survey, only 19 percent of all Americans trust the government.   Back in 1958, 73 percent of all Americans trusted the government.