Tag Archive for: data

U.S. State GDPs Compared to Entire Countries

It’s pretty difficult to even comprehend how ridiculously large the US economy is.


Click here to view the U.S. State GDPs Compared to Entire Countries map.

The map above (click to view and enlarge) matches the economic output (Gross Domestic Product) for each US state (and the District of Columbia) in 2018 to a foreign country with a comparable nominal GDP last year, using data from the BEA for GDP by US state (average of Q2 and Q3 state GDP, since Q4 data aren’t yet available) and data for GDP by country from the International Monetary Fund. Like in past years, for each US state (and the District of Columbia), I’ve identified the country closest in economic size in 2018 (measured by nominal GDP) and those matching countries are displayed in the map above and in the table below. Obviously, in some cases, the closest match was a country that produced slightly more, or slightly less, economic output in 2018 than a given US state.

It’s pretty difficult to even comprehend how ridiculously large the US economy is, and the map above helps put America’s Gross Domestic Product (GDP) of $20.5 trillion ($20,500,000,000,000) in 2018 into perspective by comparing the economic size (GDP) of individual US states to other country’s entire national output. For example:

  1. America’s largest state economy is California, which produced nearly $3 trillion of economic output in 2018, more than the United Kingdom’s GDP last year of $2.8 trillion. Consider this: California has a labor force of 19.6 million compared to the labor force in the UK of 34 million (World Bank data here). Amazingly, it required a labor force 75% larger (and 14.5 million more people) in the UK to produce the same economic output last year as California! That’s a testament to the superior, world-class productivity of the American worker. Further, California as a separate country would have been the 5th largest economy in the world last year, ahead of the UK ($2.81 trillion), France ($2.79 trillion) and India ($2.61 trillion).
  2. America’s second largest state economy—Texas—produced nearly $1.8 trillion of economic output in 2018, which would have ranked the Lone Star State as the world’s 10th largest economy last year. GDP in Texas was slightly higher than Canada’s GDP last year of $1.73 trillion. However, to produce about the same amount of economic output as Texas required a labor force in Canada (20.1 million) that was nearly 50% larger than the labor force in the state of Texas (13.9 million). That is, it required a labor force of 6.2 million more workers in Canada to produce roughly the same output as Texas last year. Another example of the world-class productivity of the American workforce.
  3. America’s third largest state economy—New York with a GDP in 2018 of $1.68 trillion—produced slightly more economic output last year than South Korea ($1.65 trillion). As a separate country, New York would have ranked as the world’s 11th largest economy last year, ahead of No. 12 South Korea, No. 13 Russia ($1.57 trillion) and No. 14 Spain ($1.43 trillion). Amazingly, it required a labor force in South Korea of 28 million that was nearly three times larger than New York’s (9.7 million) to produce roughly the same amount of economic output last year! More evidence of the world-class productivity of American workers.
  4. Other comparisons: Florida (about $1 trillion) produced almost the same amount of GDP in 2018 as Mexico ($1.19  trillion), even though Florida’s labor force of 10.2 million less than 20% of the size of Mexico’s workforce of 59 million.
  5. Even with all of its oil wealth, Saudi Arabia’s GDP in 2018 at $683 billion was below the GDP of US states like Pennsylvania ($793 billion) and Illinois ($863 billion).

Overall, the US produced 24.3% of world GDP in 2017, with only about 4.3% of the world’s population. Four of America’s states (California, Texas, New York and Florida) produced more than $1 trillion in output and as separate countries would have ranked in the world’s top 16 largest economies last year. Together, those four US states produced nearly $7.5 trillion in economic output last year, and as a separate country would have ranked as the world’s third-largest economy.

Adjusted for the size of the workforce, there might not be any country in the world that produces as much output per worker as the US, thanks to the world-class productivity of the American workforce. The map above and the statistics summarized here help remind us of the enormity of the economic powerhouse we live and work in.

So let’s not lose sight of how ridiculously large and powerful the US economy is, and how much wealth, output, and prosperity is being created every day in the largest economic engine there has ever been in human history. This comparison is also a reminder that it was largely free markets, free trade, and capitalism that propelled the US from a minor British colony in the 1700s into a global economic superpower and the world’s largest economy, with individual US states producing the equivalent economic output of entire countries.

This article is reprinted with permission from The American Enterprise Institute.

AUTHOR

Mark J. Perry

Mark J. Perry is a scholar at the American Enterprise Institute and a professor of economics and finance at the University of Michigan’s Flint campus.

RELATED TWEET:

EDITORS NOTE: This FEE column is republished with permission. ©All rights reserved.

Learning Styles Don’t Actually Exist, Studies Show

According to many researchers, the learning styles theory is the biggest myth in education.


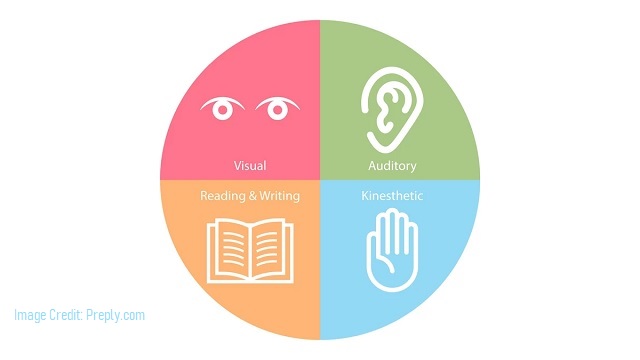
Are you a visual, auditory, reading/writing, or kinesthetic learner? For millions of students, this question has become so familiar that they already have an answer ready to go. Some identify as visual learners, which means that, in theory, they learn best by seeing concepts in pictures and diagrams, perhaps on a blackboard or in a video. Others identify as auditory learners, which means they learn best by hearing, or reading/writing learners, which means they learn best by reading books and taking notes. Still others identify as kinesthetic learners, which means they learn best when they can physically engage with things, such as in a chemistry lab.

For most of us, the idea that different people have different learning styles is so obvious that it is simply common knowledge. But there’s a problem here, a big problem. No matter how hard scientists have looked, they haven’t been able to find any good evidence for the learning styles theory. Indeed, many academics who study this for a living consider learning styles to be one of the biggest myths in education.

“There is no credible evidence that learning styles exist,” write psychologists Cedar Riener and Daniel Willingham in a 2010 paper titled The Myth of Learning Styles. “Students may have preferences about how to learn, but no evidence suggests that catering to those preferences will lead to better learning.”

If that sounds far-fetched, well, there’s plenty more where that came from.

In a 2009 review paper entitled Learning Styles: Concepts and Evidence, researchers investigated the “meshing hypothesis,” which is the idea that students learn better when instruction is provided in a format that matches their learning style. Their conclusion is a hard pill to swallow. “The contrast between the enormous popularity of the learning-styles approach within education and the lack of credible evidence for its utility is, in our opinion, striking and disturbing,” researchers wrote. “If classfication of students’ learning styles has practical utility, it remains to be demonstrated.”

2006 study looking at multimedia instruction came to a similar conclusion. “There was not strong support for the hypothesis that verbal learners and visual learners should be given different kinds of multimedia instruction,” the authors concluded.

But perhaps this is just a few fringe studies? Perhaps there is still some debate on this within academia? Not so, says the American Psychological Association. “Many people, including educators, believe learning styles are set at birth and predict both academic and career success even though there is no scientific evidence to support this common myth,” the APA wrote in a 2019 press release titled “Belief in Learning Styles Myth May Be Detrimental.” The release goes on to say that “numerous studies have debunked the concept of learning styles,” and that there is a “lack of scientific evidence supporting them.”

This lack of evidence stands in stark contrast to popular opinion. Indeed, surveys show that 80-95 percent of people in the US and other industrialized countries believe in learning styles.

Having said all that, it’s important to be clear about what exactly researchers are criticizing when they talk about the myth of learning styles. They aren’t saying there are no differences between students, or that tailored teaching approaches can never be helpful. There are plenty of individual differences between students, such as talent, background knowledge, and interest in the field, and researchers agree that teaching with these differences in mind can have a positive impact.

There is also evidence that using multiple teaching approaches together (such as words and pictures) tends to improve learning across the board, a phenomenon known as the multimedia effect. Again, researchers don’t take issue with this. What they dispute is the idea that each student has a particular learning style, and that teaching to a student’s preferred learning style will improve their educational outcomes.

For many people, the idea that learning styles don’t have scientific support is likely a bit of a shock. How could we be so wrong about something so fundamental? And how could so many people believe this if it wasn’t true? These are good questions, and they’re worth exploring. But a more unsettling question also comes to mind.

If we could be wrong about this, what else might we be getting wrong about education?

What if there are other things we’re doing in the school system that are also seriously flawed, even though we don’t realize it? What if there are other widely-believed assumptions that would also prove untrue upon closer inspection? We fall so easily into habits and routines that we become slaves to the status quo. Is it really a stretch, then, to suggest that we might have missed something else as well? Is it a stretch to wonder whether we’re even getting this whole education thing right?

What if there are better ways to learn than typical schooling, ways we haven’t even thought of? What if we’ve been duped into thinking that what we have now is the best possible approach, but really the only reason we think that is because it’s all most of us have ever known? What if most of the stuff we think is “common knowledge” about education is actually straight-up wrong? These are questions worth seriously considering.

We’re told that sitting in a classroom 6 hours a day is what kids need. But is it really? We’re told that everyone should learn the same thing at the same age, but is that really best? We’re told that everyone needs at least 12 years of formal schooling, and that this schooling should take place between the ages of 6 and 18, but is that really true? Once you start questioning the fundamental tenets of schooling we all take for granted, you realize there’s a lot we might be getting wrong.

Fortunately, we live in the 21st century, with technology and insights that previous generations simply didn’t have. As such, now is a better time than ever to go back to the drawing board and question the fundamental assumptions that form the bedrock of the education system as we know it.

Change is hard, of course. When we start asking questions that no one has asked for decades, it can be uncomfortable. But in the end, not changing is harder. When we allow myths about education to fester, like the myth of learning styles, we only do a disservice to the next generation. So rather than seeking out validation for our pre-existing views, let’s be courageous and have an open mind about these things. Let’s put our theories about education to the test and see whether they stand up to scrutiny.

The education system has been stagnant for far too long, and the persistence of bad ideas like the learning styles theory is a testament to this fact. So rather than sticking with the status quo, perhaps it’s time to put our old education assumptions aside and seek out a better approach.

AUTHOR

Patrick Carroll

Patrick Carroll has a degree in Chemical Engineering from the University of Waterloo and is an Editorial Fellow at the Foundation for Economic Education.

EDITORS NOTE: This FEE column is republished with permission. ©All rights reserved.
Climate Station Data Shows U.S. In A 10-Year Cooling Trend

The Daily Caller reports:

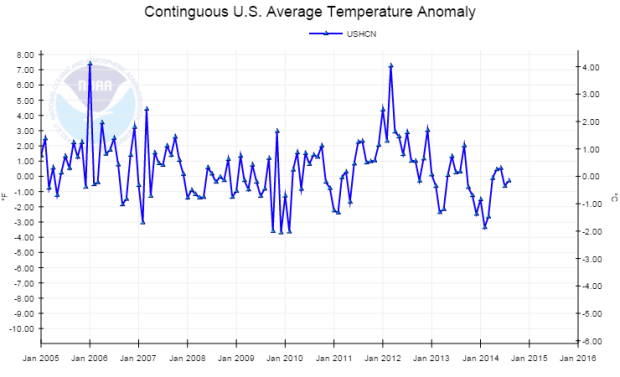
Data from America’s most advanced climate monitoring system shows the U.S. has undergone a cooling trend over the last decade, despite recent claims by government scientists that warming has accelerated worldwide during that time.

The U.S. Climate Reference Network was developed by the National Oceanic and Atmospheric Administration (NOAA) to provide “high-quality” climate data. The network consists of 114 stations across the U.S. in areas NOAA expects no development for the next 50 to 100 years.

us climate data

Read more. 

RELATED ARTICLES:

Weak sun could offset some global warming in Europe and U.S. – study

Britain faces FREEZING winters as slump in solar activity threatens ‘little Ice Age’

Predicting Earthquakes. Not.

The president of the Space and Science Research Corporation, John Casey, is also the author of “Cold Sun: A Dangerous ‘Hibernation’ of the Sun Has Begun!” and has called attention to a meteorological cycle that until the global warming hoax occurred, was largely unknown to many people and, to a large degree still is.

Nature has not cooperated with the charlatans who made claims about a dramatic warming of the Earth. Since 1998 the planet along with the Sun has been in a solar cycle distinguished by very few, if any, sun spots—evidence of solar storms—and a cooling of the Earth that has some predicting a forthcoming new Little Ice Age.

As Wikipedia reports: “Solar Cycle 24 is the 24th solar cycle since 1755, when extensive recording of solar sunspot activity began. It is the current solar cycle, and began on January 4, 2008, but there was minimal activity until early 2010. It is on track to be the Solar Cycle with the lowest recorded sunspot activity since accurate records began in 1750.” These cycles occur every eleven years.

I was surprised to receive a news release from the Space and Science Research Corporation (SSRC) on Monday with the headline “Earthquake and Volcano Threat Increases” because, frankly, I could have put out the same release and, if such activity did increase, I could claim credit for predicting it and, if not, few if any would recall I had made such a claim. While earthquake activity has been studied for decades, even the U.S. Geological Survey (USGS) makes no claim to being able to predicting when or where one will occur.

What the USGS can tell you is that their scientists (and others) “estimate earthquake probabilities in two ways: by studying the history of large earthquakes in a specific area and the rate at which strain accumulates in the rock.” A translation of this is that they have only the most minimal clues when and where one will occur. A recent International Business Times article reported that this may change as the introduction of “big data analytics” kicks in to provide “a leap of accuracy of quake predictions.”

The SSRC news release was about a letter that Casey had sent Craig Fugate, the Administrator of the Federal Management Agency which “disclosed that we are about to enter a potentially catastrophic period of record earthquakes and volcanic eruptions throughout the United States.”

Casey’s letter outlined “how the ongoing dramatic reduction in the Sun’s energy output will not only plunge the world into a decades-long cold epoch, but at the same time bring record geographic devastation in monster earthquakes and volcanic eruptions.”

Other scientists have come to similar conclusions, but after years of sorting through all the claims about global warming and “climate change”, one might want to tread lightly before embracing them.

I asked my colleague at The Heartland Institute, Science Director Jay Lehr, for his reaction and he was quite candid. “I have read it and am extremely skeptical. It sounds like the agency is looking for some press and, of course, when they turn out to be wrong no one will be upset. No harm. No foul. Being ready for earthquakes in known quake zones makes sense; creating unwarranted fear does not.”

Dr. Lehr summed up my own reaction. I would recommend his skepticism to everyone.

Will there be earthquakes here in the U.S.? Yes. The New Madrid earthquakes were the biggest in the nation’s history, occurring in the central Mississippi Valley and so large they were felt as far away as New York and Boston, Montreal and Washington, D.C. President James Madison and his wife Dolly felt them in the White House. They lasted from December 16, 1811 through March of 1812 and there were more than 2,000 quakes in the central Midwest, and between 6,000-10,000 in the boot-heel of Missouri where New Madrid is located near the junction of the Ohio and Mississippi rivers.

When will new earthquakes or volcanic eruptions occur? I doubt anyone knows the answer to that.

© Alan Caruba, 2015