True Costs of Wind Electricity by Planning Engineer and Rud Istvan
Wind turbines have become a familiar sight in many countries as a favorite CAGW mitigation means. Since at least 2010, the US Energy Information Agency (EIA) has been assuring NGOs and the public that wind would be cost competitive by now, all things considered. Many pro-wind organizations claim wind is cost competitive today. But is it?

Yet incentives originally intended only to help start the wind industry continue to be provided everywhere. This fact suggests wind is not competitive with conventional fossil fuel generation. How big might the wind cost gap be? Will it ever close? We explore these questions in four sections: incentives, lifetime costof electricity generation (LCOE), system costs, and market distortions. We examine onshore wind, since EIA says offshore is almost 3x more expensive. For simplicity, we examine EIA national averages, rather than regional ranges.
Incentives
The main US federal incentive is the wind Production Tax Credit (PTC), created by the Energy Policy Act of 1992. It is now $21.50/MWh for the first ten years of generation. It was intended to jumpstart the industry, so has expired via sunset provisions several times over the past 23 years. Each time, US wind investment promptly collapsed. Each time, Congress promptly renewed PTC at the same or higher incentive rates. Why? At Berkshire Hathaway’s (BH) 2014 annual meeting (BH’s Iowa based electric utility MidAmerican Energy has $5.6 billion invested in wind generation) Warren Buffet said:
“I will do anything that is basically covered by the law to reduce Berkshire’s tax rate. For example, on wind energy, we get a tax credit if we build a lot of wind farms. That’s the only reason to build them. They don’t make sense without the tax credit.” [1]
 U.S. Congressman Lamar Smith asked the Congressional Budget Office to estimate PTC’s 2013 cost (as part of that year’s reinstitution debate): the 2013 cost was $13 billion.
Iowa has enacted an additional state PTC of $10/MWh. Buffet gets a total PTC of $31.5/MWh from both federal and Iowa taxpayers. YE2014, BH’s MidAmerican Energy, had 2953MW of Iowa wind capacity. Warren Buffet wind farms are receiving $253 million of annual tax credit from Iowa wind generation on an investment of $5.6 billion (2953 MW * 0.31CF * 8766 hr/year *$31.5/MWh). BH’s effective tax rate last year was 31%. Those wind credits are equivalent to earning (253/0.31) $816 million on his $5.6 billion wind investment—a 15% return before any operating profit from selling electricity. That is a good deal for the Nebraska billionaire, but not for the rest of us.
The EIA estimates wind costs five years in the future. Since 2010, each cost estimate has had a separate entry for subsidies. Each estimate since 2012 (for 2017) has zero wind subsidies. EIA assumes the PTC expires (it has yet again YE2014). The Obama administration is proposing it be made permanent, with strong support from the AWEA (American Wind Energy Association). This suggests EIA’s estimated wind costs are too low, and partly political rather than mostly factual. How much is shown by closer examination of their other cost components.
LCOE
The most recent ‘official’ EIA estimates are available in Table 1 of EIA’s Annual Energy Outlook 2015, Electricity Generation Forecasts. The EIA explains:
Levelized cost of electricity (LCOE) is often cited as a convenient summary measure of the overall competiveness of different generating technologies. It represents the per-kilowatthour cost (in real dollars) of building and operating a generating plant over an assumed financial life and duty cycle. Key inputs to calculating LCOE include capital costs, fuel costs, fixed and variable operations and maintenance (O&M) costs, financing costs, and an assumed utilization rate for each plant type. The importance of the factors varies among the technologies. For technologies such as solar and wind generation that have no fuel costs and relatively small variable O&M costs, LCOE changes in rough proportion to the estimated capital cost of generation capacity.
EIA’s LCOE is the annualized net present value (aka annual annuity cost). The estimate is always 5 years into the future. That is why their 2010 estimate above was only verifiable in 2015.
EIA calculates LCOE as the sum of five components: Capital, Fixed O&M, Variable O&M (including fuel), Transmission (incremental), and Subsidies (none). Capital costs are spread over a 30-year life at an interest rate of 6.5%. This appears superficially reasonable, but as we show below, isn’t. Following are the basic LCOE generation comparisons in $/MWh and capacity factor (CF) %, from the EIA AEO 2012 and 2014.
………………………CF% ($2017) ($2019)
CCGT 87 66.1 66.3
Conv.Coal 85 97.7 95.6
Wind 35 96.0 80.3
GT (peaker) 30 127.9 128.4
Three things stand out. Combined cycle gas turbine (CCGT) costs are cheaper than coal. That makes directional sense; in the US CCGT is gaining share at the expense of coal. CCGT cost advantages include: (a) better net thermal efficiency (61% versus 41% for USC coal), (b) abundant inexpensive natural gas thanks to fracked shale, and (c) cheaper capacity. It takes three years to build a CCGT for about $1000-1250/kw. USC coal takes 4 years to build for about $2850/kw.[2]Peak load gas turbine (GT) capacity only costs about $750/kw, but its LCOE is twice CCGT because its capital is under utilized–only operating 30% of the time. Finally, EIA says wind is competitive with coal and will become more so (about 20% more in just three years!).
‘True’ wind LCOE is understated since the PTC is missing. The annuity value of $21.5/MWH for 10 years at 6.5% interest, annuitized over 30 years is $7.2/MWh. A ‘truer’ comparison to coal is (96+7) ~$103/MWh from the general taxpayer perspective, rather than from Warren Buffet’s.
This unsurprising result just shows the PTC was intended to make wind ‘grid competitive’, and seems to do so—at taxpayer expense. That is why investment collapses toward zero in its absence. There are, however, two further ‘obvious’ plus two additional ‘hidden in the fine print’ issues with the EIA LCOE comparisons that are equally consequential, and similarly biased.
Wind capital cost
Wind capital declines 22% from 2017 to 2019; CCGT only declines 8%. This difference is not attributable to turbine production volume. According to GWEC,51,473 MW was delivered globally in 2014, comprising at least 17000 units (at ~3MW each). Installation costs don’t scale. Past reductions in wind capital per megawatt came from developing larger turbines, not from increased volume.
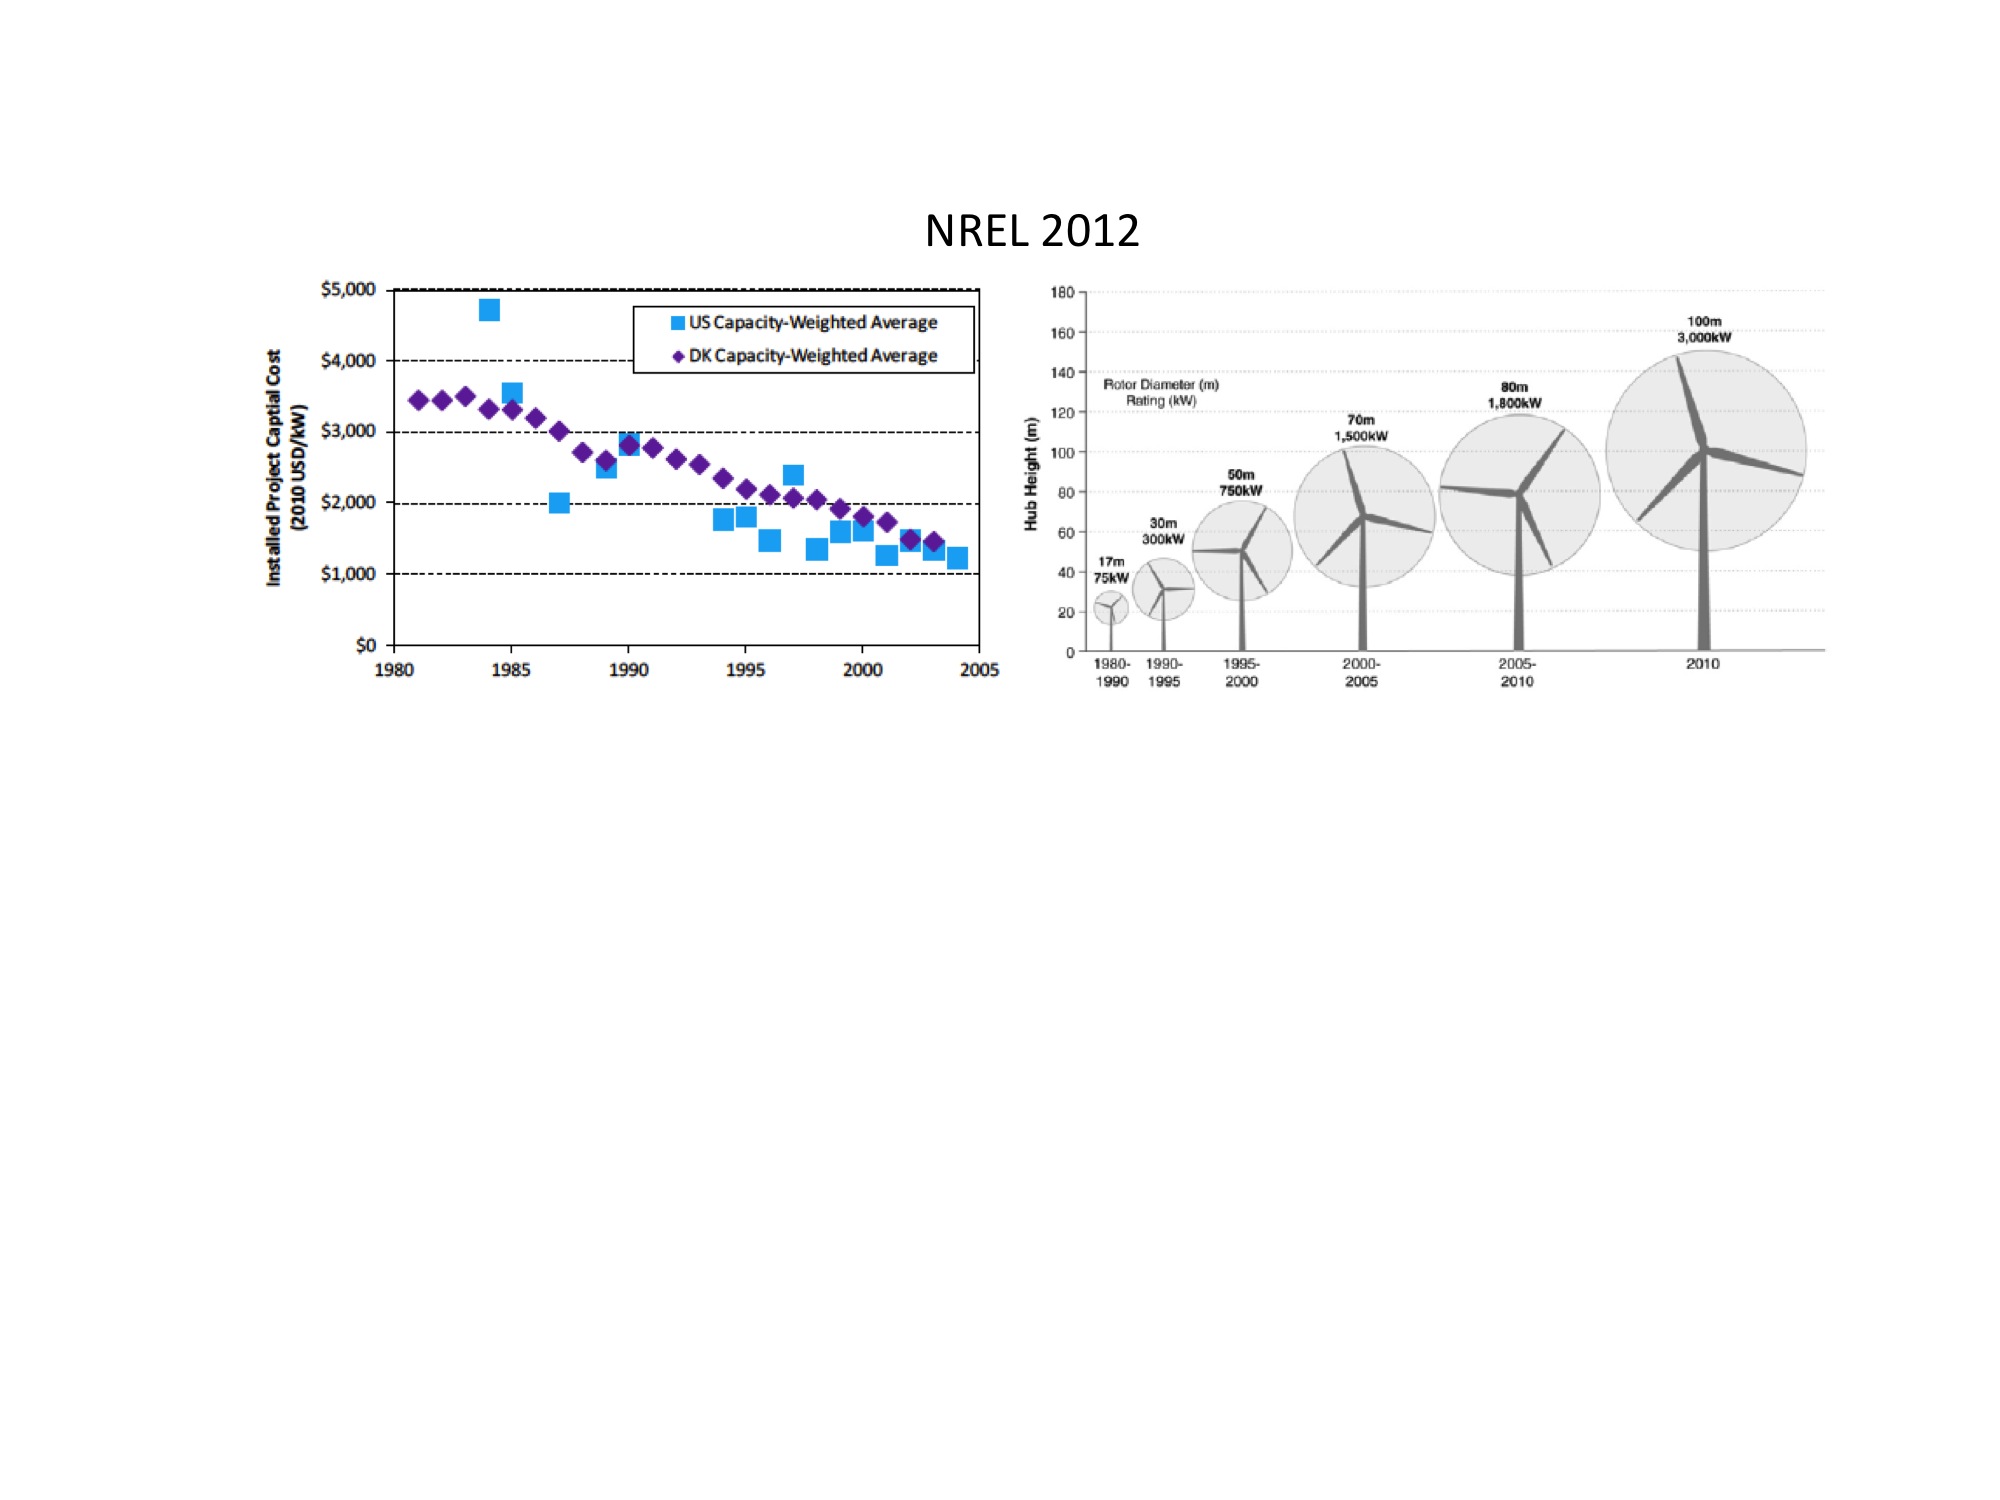 But actual installed cost/MW stopped declining, and started rising around 2005. There are few onshore turbines larger than 3 MW because of transportation (road/rail) constraints on blade length. The above 2012 NREL composite chart isdeliberately misleading; it ended in 2005 although LBNL data was available to 2011.
 EIA’s projected 22% decline in wind capital LCOE is very dubious. We shall use $96/MWh total, the same as EIA’s 2010 LCOE midpoint charted above.
Capacity Factor
The record US annual wind capacity factor was 2014 at 33.9%. EIA itself says the median CF over the past decade is 31%. (Still better than the UK, where CF ranged from a low of 21.5% in 2010 to a record high 27.9% in 2013.) The assumed US 35% CF is unrealistically optimistic. [3]
 Using the historic median CF, a ‘truer’ wind LCOE is roughly (35/31*$96/MWh) $108/MWh.Using the historic median CF, a ‘truer’ wind LCOE is roughly (35/31*$96/MWh) $108/MWh.
Fine Print interest rate
The first fine print fudge is the annuity interest rate. The 2014 EIA text says 6.5% (same as 2012). Ah, but the fine print also says that for coal generation withoutcarbon capture and sequestration (CCS), 9.5% is used. EIA’s fine print inside that fine print says this is the equivalent of a $15/ton CO2 emissions tax on coal (buried inside Capital rather than exposed in Variable O&M explicitly including fuel cost).
EIA says conventional coal produces about 2.15 pounds of CO2 per kWh (depending slightly on coal rank). That is ~2.15 tons of CO2 /MWh, a ‘hidden’ LCOE coal fuel penalty of (2.15*$15) $32.25. There is no US ‘carbon tax’; Congress refused to enact Obama’s proposal. A ‘truer’ comparison is wind at $108/MWh to coal at $65.45/MWh.
This also makes intuitive sense. The newest technology UltraSuperCritical (USC) coal must be similar in cost to CCGT in favorable locations (considering coal transport and quality). One was just completed for $1.8 billion (SWEPCO’s 600MW Turk plant in Arkansas) and 10 additional USC coal facilities are presently planned for the US. None of these will be built until the constitutionality of EPA’s proposed CO2 limit (which effectively prohibit them) is settled.
Fine Print lifetime
EIA comparisons are based on a 30-year lifetime; this introduces a large bias. The EIA itself says the average age of the US coal fleet is 42 years; effective coal lifetime is at least that. GE’s marketing materials say the expected life of its CCGT is at least 40 years. In other words, the capital annuity component of non-wind LCOE should be reduced by ~25% to reflect longer useful lives (40 rather than 30 year annuity, EIA capital only, 0.065 r). That is $8.35/MWh lower LCOE for coal after first subtracting the $32.25 fuel penalty hidden in capital, and $4.30/MWh lower for CCGT.
On the other hand, the design life for wind is 20 years; with maintenance they may last 25 years. EIA’s assumed wind lifetime is longer than the industry’s most cheery estimate, thereby understating LCOE. A ‘truer’ comparison would be wind at (capital component annuity 25 rather than 30 years, 0.065 r) $121/MWh compared to 40 year CCGT $57.5/MWh and Coal $57.1/MWh. ‘True’ wind LCOE is about twice the cost of conventional generation from either coal or natural gas.
Studies of UK and Denmark wind farms suggest their actual economic lives appear to be 12-15 years due to wear and tear.[4] One of the unanticipated problems that arose with larger turbines is premature cracking failure of the main axial bearing(s). These failures arise from two very difficult engineering conditions. First is uneven loading. Wind speeds increase with altitude so the three blades, which span great distances, are never evenly loaded. The bearing(s) wobble under the tremendous forces generated. Second, braking when wind speed exceeds 25mph suddenly loads reverse torque on the axial side where previously unloaded (and wobbling) individual bearings are in natural misalignment to their trace. If things go ‘well’, cracking can be caught before catastrophic failure. It is expensive to repair. The blades must be detached so the turbine can be dismounted and sent back to the factory. The following image shows a 3MW unit.

Sometimes things do not go well.
 To summarize the second section on LCOE: EIA’s wind future capital, capacity factor, and lifetime all understate the ‘true’ cost of wind. Conventional coal generation is misleadingly overstated. Given other information provably at EIA’s disposal, its wind-biased US findings appear driven by political considerations.
System Costs
We have looked at wind from the perspective of wind farmers and electricity generators. But that is not the whole story, since wind is intermittent. Intermittency has two broad utility system consequences not captured in generation LCOE. First, the grid has to have some level of offsetting backup generation to maintain stability. Those costs are not borne by wind operators unless they also happen to own the regional grid. Most don’t. Second, transmission capacity has to be added. The full extent of those costs is not usually borne by windfarms, but rather (again) by grid owners.
Intermittent backup
Grids always have some spare capacity beyond average peak load. This safety margin handles unexpected peaks, unplanned outages, and other random fluctuations. How much depends on a grid’s many specific details, but 10 – 20% reserve margins are typical. A portion of this amount must be fast start gas turbines, or spinning reserves (older smaller depreciated plants operating at minimum capacity that can be ramped as needed), or flexible hydro, or (newly) flexible CCGT. For very small wind generation proportions, the ‘normal’ reserve suffices. As the percentage of wind in the generation mix grows, it increasingly does not. There are inefficiency costs and (depending on the grid) additional backup capacity costs incurred by the system as a whole.
Additional backup requirements depend on grid details beyond just wind generating penetration. For example, Ontario generation is about 58% nuclear, 24% hydro, and 4% wind (although wind is growing since Ontario subsidizes it with above market feed in tariffs). Nuclear is base loaded. Hydro is flexed for peak loads. The large proportion of hydro in Ontario means wind can grow to double-digit penetration without any significant additional backup capacity costs.
Backup has been studied for the UK National Grid and the Texas ERCOT grid, both of which have a more traditional generation mix than Ontario as well as higher wind penetration.
UK’s zero wind for three days 12/11-13/12 during its winter peak load season illustrates the National Grid’s need for wind backup. UK peak load is handled by flexing fossil fuel generation.
 Newer CCGT is specifically designed to flex as efficiently as possible. In recent years GE, Siemens, Alstom, and Mitsubishi have all introduced units. For example, GE’s FlexEfficiency 50 is a 510MWCCGT that can ramp 50MW/minute. At rated output, it operates 61% efficient. It is 60% efficient down to 87% load, and 58% efficient at 40% load (and not designed to operate below 40%). Cycling at less than rated output increases capital cost/MWh via under utilization, and increases fuel cost via reduced efficiency. Notionally, wind 30% CF means a supporting FlexEfficiency 50 running 70% of the time at rated capacity, and the remainder at 40% minimum load. Using GE’s numbers, that would add about $7.20/MWh LCOE of wind intermittency flex cost on a 30-year annuity basis.[5]
The Texas ERCOT grid is quite different. It has high summer peak load demand because of air conditioning. Texas backup capacity is therefore from high LCOE gas turbine peaker units which are unused except in summer.
 As the proportion of wind generation increases, grids less blessed than Ontario have to add additional standby capacity of some sort. How much of which sort depends on grid details like those illustrated above. The UK National Grid has published estimates. An analysis by the UKERC suggested 15-22% additional for 10% wind production. A different analysis by the IEA ranged from 6% at 2.5% wind generation, to 12% at 5%, to 18% at 15%.[6] UK wind is presently 9.3% of generation. For the UK National Grid using flexed CCGT, these estimates imply about ($66.1+$7.2/MWh *0.15) ~$11/MWh for additional backup, a ‘truer’ wind LCOE of ($121+$11) $132/MWh for UK’s National Grid
On the Texas ERCOT grid, wind in 2014 was 10.6% of generation. For ERCOT’s summer gas peakers, wind’s ‘true’ cost is about ($121+ 0.15*$128) $140/MWh. Little wonder the Austin, Texas utility finds its renewable generation portfolio loses $80 million, while its fossil fuel generation earns $180 million annually at grid wholesale electricity rates! [7]
Transmission constraints
ERCOT also illustrates clearly the wind impact on transmission planning. Much of the wind capacity is in northern Texas, whereas the demand is in Dallas and Houston. ERCOT’s ‘CREZ’ wind driven grid capacity expansion added/upgraded 3600 miles of transmission lines at a cost of $6.9 billion over 3 years. That compares to $26 billion of cumulative (YE2014) investment in Texas wind generation. Annualized over 30 years at 6.5% and spread over ERCOT’s 36.1 million MWh of 2014 wind generation, CREZ adds wind LCOE of $6.44/MWh. That is 6.7% of EIA’s wind LCOE. EIA’s own incremental transmission estimate is 4%–yet again biased substantially low. The ‘true’ system LCOE of ERCOT wind is ($140+$6) ~$146/MWh, not anywhere near the general EIA estimate of $96/MWh — it is off by half.

In the UK, lack of transmission capacity between Scotland’s wind farms and England/Wales consumers has led to National Grid Balancing Mechanism‘constraint payments’ netting about £165/MWh for wind NOT produced when it could have been. That comes out of British ratepayer pockets, even though they get no electricity in return.
Market Distortions
In 2011, MIT’s Paul Joskow circulated a Sloan School discussion paper pointing out that non-dispatchable generation (wind) not only has a different cost profile, it has a different value (price) profile.
“Wholesale electricity prices reach extremely high levels for a relatively small number of hours each year (see Figure 1) and generating units that are not able to supply electricity to balance supply and demand at those times are (or should be) at an economic disadvantage. These high-priced hours account for a large fraction of the quasi-rents that allow investors in generating capacity to recover their investment costs (Joskow 2008) and failing properly to account for output and prices during these critical hours will lead to incorrect economic evaluations of different generating technologies.”
Here’s a rough overview of studies that have looked at the impact of intermittent wind upon energy markets. This British study found that wind serves to change the capacity mix more so than the pattern of prices. The market shift to lower fixed cost higher variable cost stations results in relatively small price changes. This study from Ireland finds that increased wind penetration does not impact the pricing of electricity in Ireland (that is argued in the paper as a plus for encouraging more wind). This study found that wind in Denmark reduced costs to consumers. This study of ERCOT in Texas found that the spot market prices were reduced but price variance, volatility and risk increased. This study of the Pacific Northwest concluded that despite being more economical and easier to integrate in a hydro-rich area, “the direct economic benefits to end-users from greater investment in wind power may be negligible.” There are many factors to consider and the interactions between spot prices and long term cost savings are uncertain. Perhaps the situation is best summed up as this report concluded, “the financial impacts of wind power generation are unclear due to the complex nature of wholesale power markets and the many variables that can impact wholesale electricity prices and generator revenues (i.e., location, natural gas prices, generation mix, and electricity demand).” It is not clear in any case that subsidizing wind production will lower overall energy prices in any region, and we already showed that subsidized wind raises generation costs.
Wind generation is associated with challenges in scheduling resources and participation in energy markets. Operators serve load with a varied generation mix. Generation plants have limited flexibility including minimum and maximum output levels, ramp up limitations, minimum down times and startup costs. The unpredictability of wind complicates the resource scheduling process. For more background see these Climate Etc postings: Watch out for the Duck Curve and All Megawatts Are Not Equal.
There is a limit to how far conventional plants can be backed down and remain available for service when they may be needed in the upcoming scheduling period. Wind availability coupled with low load periods can present major problems for system operators. It may be the case of simply having mismatched loads and generation of conventional plants may be needed to maintain gridreliability. Under “constraint payments” generators are paid for not injecting power into the grid. Under “negative power pricing” generators are charged for injecting power into the grid. Overwhelmingly conventional resources are not giving favorable treatment relative to intermittent resources.
This Study notes the additional harm caused by the US Production Cost Credit, which incents wind generators to make money by injecting power even during times of oversupply. Short term this impacts reliability and raises costs for others. Long term this serves to destabilize the market for conventional generation, which will defer investment and lead to further reliability concerns.
The ERCOT region was plagued by negative pricing concerns until the CREZ transmission improvements reduced such instances.
 Some have argued from this that increased transmission build up can solve the problem of negative pricing and touted Texas as an example. However, what the transmission build out did was expose the wind resources to a larger market pool, thus reducing the effective penetration level of wind. The problem that wind at significant penetration levels will cause negative pricing remains. If you increase the penetration level in the larger pool, negative problems will remerge. Consistent with that, as Texas has continued to add wind resources, negative pricing problems reemerged in March of this year.
Conclusion
It is reasonable to ask why utilities still invest in wind, when even after PTC ‘true’ wind generation is very uncompetitive with Coal or CCGT, as well as distorting the entire wholesale electricity marketplace. EIA LCOE is not the whole story. EIA does not include other incentives such as state level above market feed in tariffs. Ontario wind gets 13.5¢/kwh versus the Province’s 2014 average wholesale generation price of 9.25¢/kwh–a 46% premium. Texas has a variety of state wind incentives (e.g. job credits and property tax breaks) estimated to cost $1 billion in 2014. Oklahoma has a complete income tax moratorium on wind farms. In 2011, California mandated 33% renewables by 2020 no matter the cost (up from 20% in 2006). The UK has the 2008 Climate Change Act. Germany has the Energiewende. Wind operators generally do not pay a price penalty for the market distortions they create. The most severe example of distorted consequences is Germany’s E.ON utility. Late in 2014 E.ON announced it was taking a $5.6 billion impairment charge on its conventional generating assets then spinning them off into a separate (unprofitable) company.[8] Conventional generation simply is no longer profitable in Germany given Energiewende’s renewables pricing distortions and forced flexing.
We can only approximate the ‘true’ cost of wind, and how much the reality differs from ‘official’ EIA (and industry) claims. Wind resources have often been presented in a far more favorable light than they deserve. Looking at the costs presented here they are far higher than can be justified. It has been hoped that subsidies would make wind self-sustaining in short order, but wind appears no closer to economic viability today than years ago.
The impacts of subsidized wind upon electricity markets are highly uncertain, and in many cases demonstrably harmful. Wind serves to raise costs, complicate scheduling, destabilize markets, and adversely impact reliability all in a hopeless effort to receive “free” energy that is actually quite costly.
The potential for wind is limited. Any sub area can have a high penetration of renewables if those resources are diluted into a larger area. Wind can provide adequate performance when correctly integrated with hydro and fossil resources. But the challenges are significant at this time to reach high penetration levels within most standalone resource mixes in most system grids.
[1] US News and World Report 5/12/2014
[2] Essay No Fracking Way in ebook Blowing Smoke.
[3] The aptly named National Renewable Energy Lab (NREL) has an even worse bias. Their 2013 “Transparent Cost Database” (a misnomer) has a selection biased sample of 109 onshore wind farms with a CF of 39% used for LCOE.
[4] Renewable Energy Foundation, Wear and Tear Hits Windfarm Output and Economic Life (2012). Available at www.ref.org.uk. See also Staffel and Green,How does wind farm performance decline with age?, Renewable Energy 66: 775-786 (2014).
[5] We decided not to put this calculation in the text due to its complexity. CCGT LCOE capital $14.3/MWh. 70% operating at rated capacity, and 30% operating at 40% (14.3/.4) costing $21.45. Fuel inefficiency at 40% rated output is (61/58) times LCOE $49.1, a difference of $2.54. Total rated output difference is $23.99/MWh, but only for 0.3 of the time, so Δ$7.20/MWh.
[6] Holttinen et. al., Design and operation of power systems with large amounts of wind power, Final Report IEA Wind Task 25, p.170 (2009)
[7] Texas Comptroller of Public Accounts, Texas Power Challenge (2014)
[8] BloombergBusiness 11/30/14
JC note: As with all guest posts, please keep your comments relevant and civil.
