
Which Race, Gender, Generation, Education groups support Democrats or Republicans?
A new analysis of long-term trends in party affiliation among the public provides a detailed portrait of where the parties stand among various groups in the population. It draws on more than 25,000 interviews conducted by the Pew Research Center in 2014, which allows examination of partisan affiliation across even relatively small racial, ethnic, educational and income subgroups. ( Explore detailed tables for 2014 here.)
The share of independents in the public, which long ago surpassed the percentages of either Democrats or Republicans, continues to increase. Based on 2014 data, 39% identify as independents, 32% as Democrats and 23% as Republicans. This is the highest percentage of independents in more than 75 years of public opinion polling. (For a timeline of party affiliation among the public since 1939, see this interactive feature.)
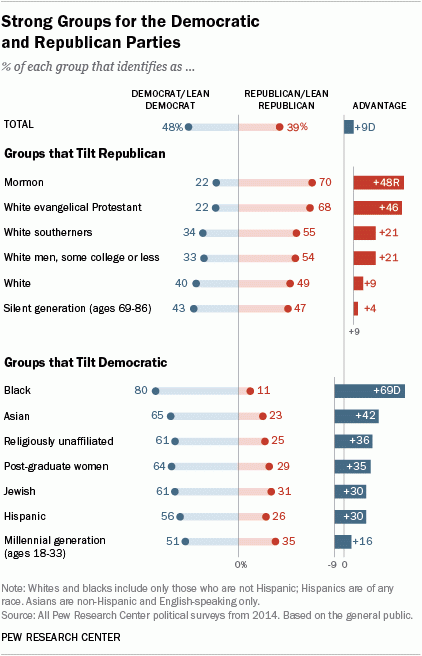
When the partisan leanings of independents are taken into account, 48% either identify as Democrats or lean Democratic; 39% identify as Republicans or lean Republican. The gap in leaned party affiliation has held fairly steady since 2009, when Democrats held a 13-point advantage (50% to 37%).
RELATED ARTICLES:
Book Review: Mike Lee on the 6 ‘Lost’ Provisions of the Constitution
Rand Paul to Media: Ask Democrats If It’s ‘OK to Kill 7-Pound Baby’
This State Is Taking the Lead on Civil Asset Forfeiture Reform
How Our High Corporate Tax Rate Hurts Our Economy
Many Americans Will Be in the 1% (For One Year)
