
How Much is Gasoline in Europe Today Compared to the United States?
First let’s look at U.S. Average Gas Prices by State — October 2026
National average: $4.28/gal (mid-October, AAA data) — up more than $1/gal since the war with Iran began in March, and well above the $3.14 seen a year ago.
Here’s the full state-by-state breakdown:
Most Expensive States
| State | Avg Price/gal |
|---|---|
| California | $6.15 |
| Hawaii | $5.63 |
| Nevada | $5.38 |
| Washington | $5.37 |
| Oregon | $4.93 |
| Alaska | $4.91 |
| Idaho | $4.80 |
| Utah | $4.77 |
Cheapest States
| State | Avg Price/gal |
|---|---|
| North Carolina | $3.59 |
| Georgia | $3.72 |
| Texas | $3.76 |
| South Carolina | $3.80 |
| Indiana | $3.82 |
| Tennessee | $3.83 |
| Louisiana | $3.85 |
| Mississippi | $3.88 |
| Alabama | $3.89 |
| Arkansas | $3.90 |
The Rest
| State | Price | State | Price |
|---|---|---|---|
| Arizona | $4.60 | Missouri | $3.95 |
| Colorado | $4.32 | Montana | $4.46 |
| Connecticut | $4.34 | Nebraska | $4.34 |
| Delaware | $4.02 | New Hampshire | $4.25 |
| Florida | $4.04 | New Jersey | $4.23 |
| Illinois | $4.65 | New Mexico | $4.32 |
| Iowa | $4.13 | New York | $4.41 |
| Kansas | $3.98 | North Dakota | $4.14 |
| Kentucky | $3.92 | Ohio | $4.00 |
| Maine | $4.34 | Oklahoma | $3.95 |
| Maryland | $4.09 | Pennsylvania | $4.48 |
| Massachusetts | $4.26 | Rhode Island | $4.21 |
| Michigan | $4.46 | South Dakota | $4.23 |
| Minnesota | $4.24 | Vermont | $4.38 |
| Virginia | $4.09 | West Virginia | $4.19 |
| Wisconsin | $4.18 | Wyoming | $4.47 |
Key Takeaways
- West Coast penalty is brutal — California runs nearly $2.40/gal above North Carolina. That’s the cost of boutique fuel blends, carbon mandates, and heavy state excise taxes stacked on top of the federal baseline.
- The war premium is real: Brown University pegs the post-March price spike at over $70 billion in extra consumer costs. That’s a direct transfer from American households to whoever controls the taps — and it’s exactly the kind of thing that never shows up in the official inflation talking points with any urgency.
- Diesel is climbing faster than gasoline, which means everything shipped by truck — which is everything — gets more expensive. The pump price is just the visible tip.
If you’re planning a road trip, the map is simple: head southeast, avoid the coasts. The heartland is where the pump still treats you like a customer instead of an ATM.
Compare gasoline prices across the European Union with this table, sorted by price and converted to US dollars per gallon for easy comparison with American fuel costs.
Now let’s look at the Average Gasoline Prices in Europe
Last updated: October 22, 2026 · Data from: October 19, 2026 · Source: European Commission Oil Bulletin. Updated every Thursday.
| Country | €/Liter | €/Gallon | $/Gallon |
|---|---|---|---|
| Denmark | €2.60 | €9.84 | $11.06 |
| Netherlands | €2.39 | €9.05 | $10.16 |
| Finland | €2.33 | €8.82 | $9.91 |
| France | €2.23 | €8.44 | $9.48 |
| Greece | €2.19 | €8.29 | $9.31 |
| Germany | €2.18 | €8.25 | $9.27 |
| Portugal | €2.10 | €7.95 | $8.93 |
| Italy | €2.02 | €7.65 | $8.59 |
| Belgium | €1.99 | €7.53 | $8.46 |
| Ireland | €1.97 | €7.46 | $8.38 |
| Estonia | €1.95 | €7.38 | $8.29 |
| Latvia | €1.95 | €7.38 | $8.29 |
| Lithuania | €1.95 | €7.38 | $8.29 |
| Romania | €1.90 | €7.19 | $8.08 |
| Slovakia | €1.89 | €7.15 | $8.04 |
| Czechia | €1.86 | €7.04 | $7.91 |
| Austria | €1.82 | €6.89 | $7.74 |
| Croatia | €1.81 | €6.85 | $7.70 |
| Luxembourg | €1.79 | €6.78 | $7.61 |
| Spain | €1.78 | €6.74 | $7.57 |
| Hungary | €1.77 | €6.70 | $7.53 |
| Cyprus | €1.76 | €6.66 | $7.48 |
| Slovenia | €1.75 | €6.62 | $7.44 |
| Bulgaria | €1.65 | €6.25 | $7.02 |
| Sweden | €1.64 | €6.21 | $6.97 |
| Poland | €1.56 | €5.91 | $6.63 |
| Malta | €1.34 | €5.07 | $5.70 |
Liter prices from the European Commission Oil Bulletin (EUR). Gallon = 3.785 L. USD column applies today’s ECB EUR→USD reference rate of 1.1234.
Euro-Super 95 (Gasoline/Fuel) prices in the 27 EU Countries. Source: European Commission.
Fuel Prices in Europe Maps
Static Map: Gasoline Prices in the EU

- Northern premium: Denmark, the Netherlands and Finland cluster above $9.90/gal, a function of heavy excise regimes and, in Germany’s case, a national carbon surcharge now embedded in the pump price.
- Eastern floor: The Baltics, Romania and Slovakia hover near €1.90/L ($8.04–$8.29/gal), closer to continental refinery wholesale than to the Nordic tax wall.
- Malta’s outlier: At €1.34/L ($5.70/gal), Malta is nearly half Denmark’s price, a reminder that EU membership harmonises little about what drivers actually pay.
Interactive Map: Gasoline Prices in the EU
Click on any EU country on the map below to view gasoline prices per liter (EUR) and per gallon (USD):
Above $9.00/gal
- Denmark: €2.60/L ($11.06/gal)
- Netherlands: €2.39/L ($10.16/gal)
- Finland: €2.33/L ($9.91/gal)
- France: €2.23/L ($9.48/gal)
- Greece: €2.19/L ($9.31/gal)
- Germany: €2.18/L ($9.27/gal)
$8.00 to $8.99/gal
- Portugal: €2.10/L ($8.93/gal)
- Italy: €2.02/L ($8.59/gal)
- Belgium: €1.99/L ($8.46/gal)
- Ireland: €1.97/L ($8.38/gal)
- Estonia: €1.95/L ($8.29/gal)
- Latvia: €1.95/L ($8.29/gal)
- Lithuania: €1.95/L ($8.29/gal)
- Romania: €1.90/L ($8.08/gal)
- Slovakia: €1.89/L ($8.04/gal)
$7.00 to $7.99/gal
- Czechia: €1.86/L ($7.91/gal)
- Austria: €1.82/L ($7.74/gal)
- Croatia: €1.81/L ($7.70/gal)
- Luxembourg: €1.79/L ($7.61/gal)
- Spain: €1.78/L ($7.57/gal)
- Hungary: €1.77/L ($7.53/gal)
- Cyprus: €1.76/L ($7.48/gal)
- Slovenia: €1.75/L ($7.44/gal)
- Bulgaria: €1.65/L ($7.02/gal)
$6.00 to $6.99/gal
- Sweden: €1.64/L ($6.97/gal)
- Poland: €1.56/L ($6.63/gal)
Below $6.00/gal
- Malta: €1.34/L ($5.70/gal)
In sum, the EU retail range on 19 October 2026 ran from a low of $5.70/gal in Malta to a high of $11.06/gal in Denmark, a gap of $5.36/gal across a nominally single market.
EU-Average Gasoline Price Trends

- Range: €1.590/L (22 Dec 2025) to €2.104/L (28 Sep 2026), a 32% swing across the year.
- Momentum: Softer in the near term (-4.83% over four weeks) but still up +2.82% over 12 weeks and +22.90% year-on-year.
- Volatility: Elevated, driven by Middle Eastern supply risk, Russian refinery disruptions, and a euro trading near 1.12 against the dollar.
Source: European Commission Weekly Oil Bulletin.
Historical Maps: 2017 and 2021
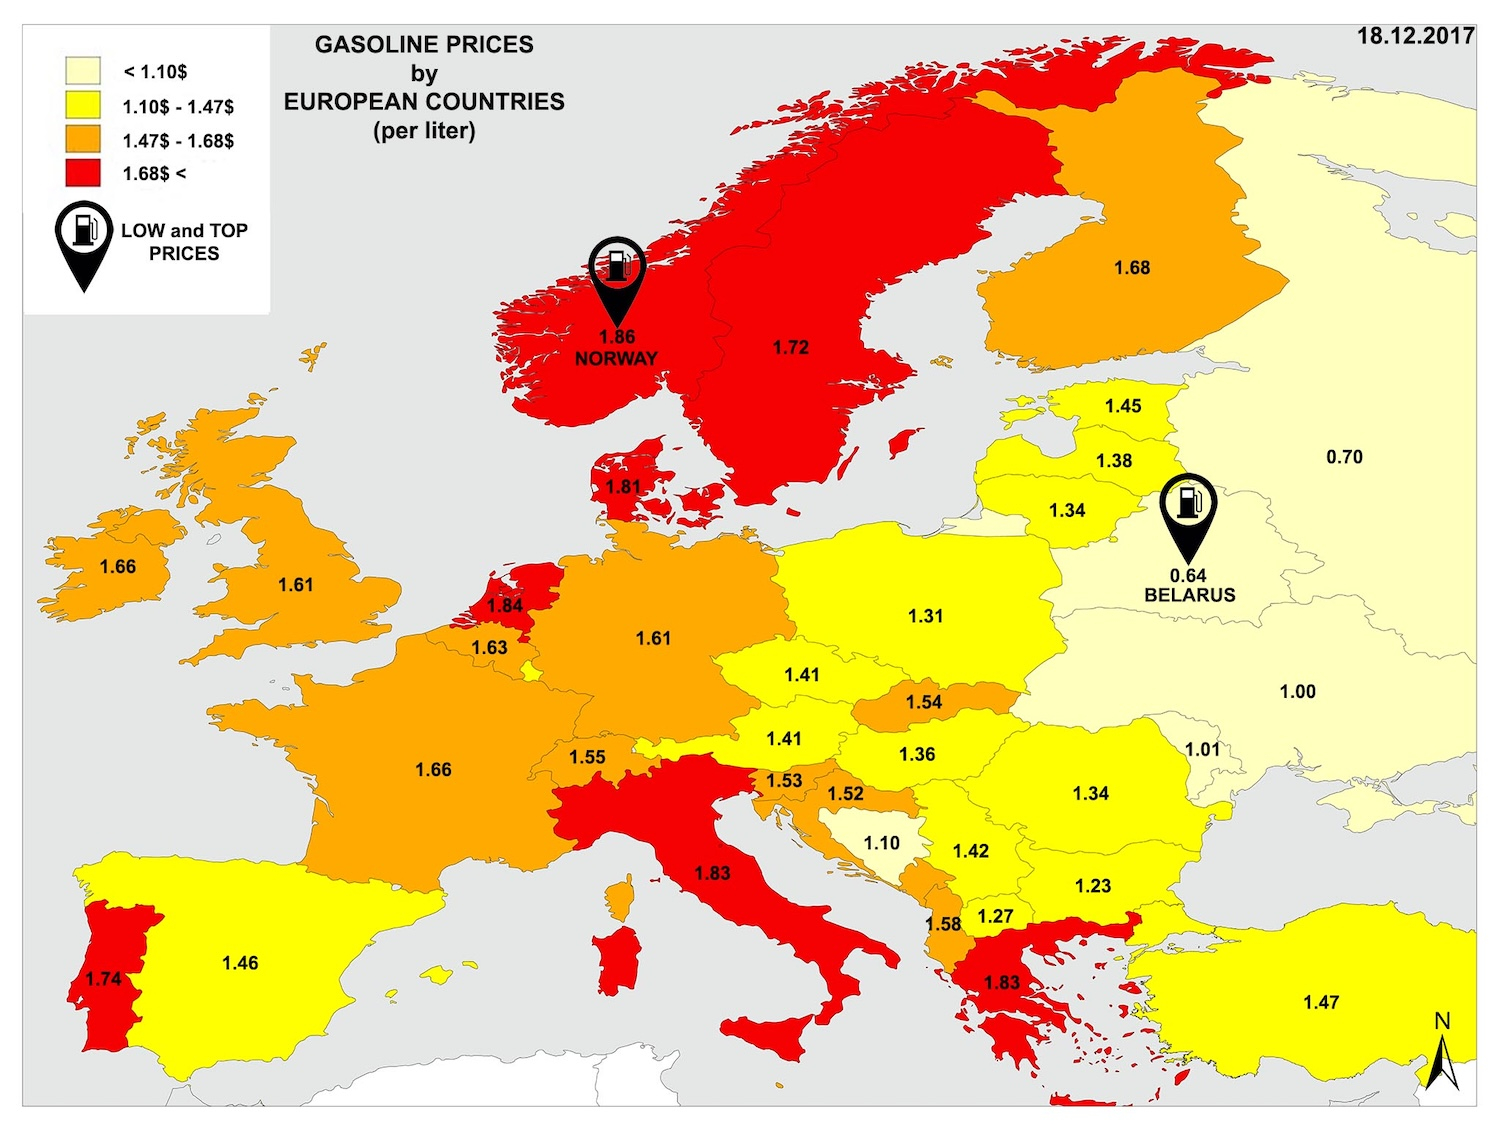
December 2017 — the pre-pandemic baseline
The 2017 map captured a Europe where the simple average gasoline price sat around $1.42 per liter ($5.38 per gallon) — less than half of where the EU-27 average stands today. The dispersion across the continent was already wide. Norway ($1.86/L) and Italy ($1.84/L) topped the table, both driven by some of the highest excise + VAT loadings in Europe. The Netherlands, Sweden and Greece filled out the rest of the expensive cluster, all over $1.65 per liter.
At the cheap end, Belarus ($0.64/L), Russia ($0.70/L) and Kazakhstan ($0.63/L) sold gasoline at a third of Norwegian prices — subsidised, oil-producing, and outside the EU’s tax-and-tariff architecture. Inside the EU, the eastern flank (Poland, Romania, Bulgaria) sat between $1.10 and $1.25, reflecting lower excise duties and lighter VAT regimes than their western neighbours.
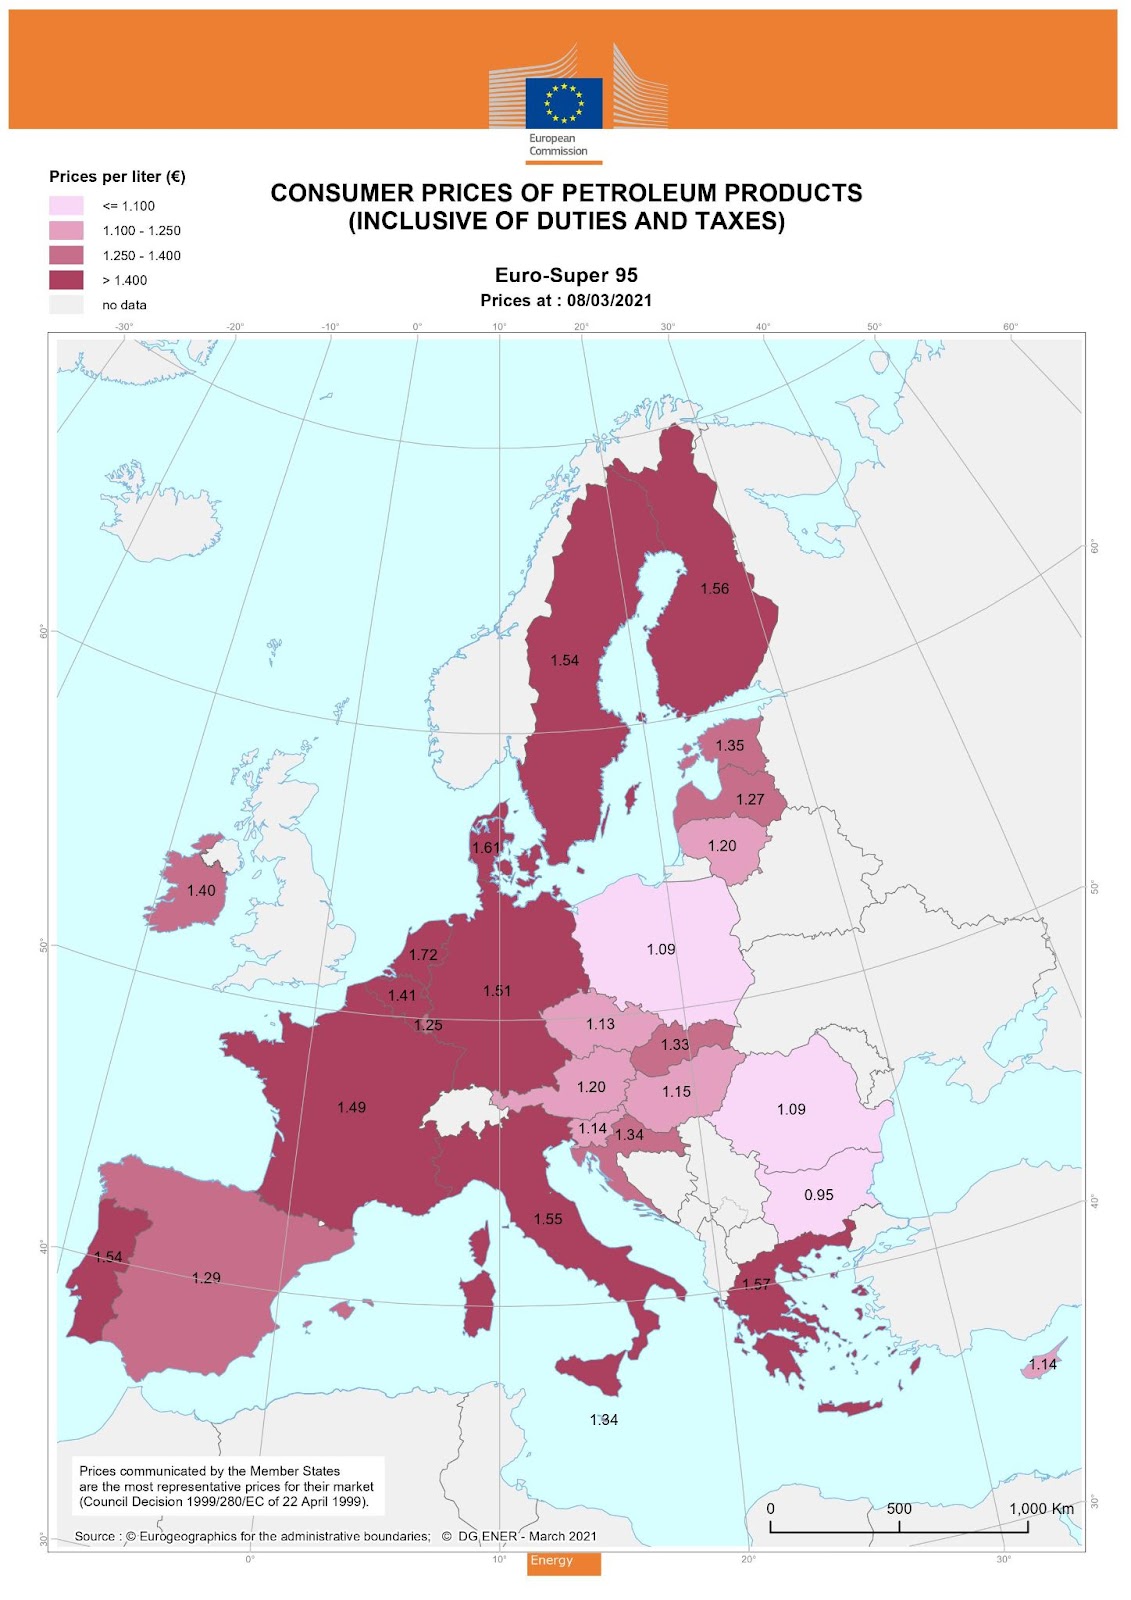
March 2021 — after the pandemic shock
Three years later the picture shifted but the geography stayed familiar. The EU average climbed to €1.36 per liter as economies reopened and Brent crude recovered from its April 2020 trough. The Netherlands (€1.72) and Greece (€1.57) led the expensive end, with Italy, Finland and Sweden close behind. The eastern budget tier held: Bulgaria (€0.95), Poland (€1.09) and Romania (€1.11) remained the cheapest forecourts in the bloc.
By 2021 a structural pattern had become unmistakable. The north-western EU — high excise, high VAT, high household income — ran ~50% above the eastern flank. The Mediterranean middle (Spain, Portugal, Italy) sat above the eastern band but below the north, balancing higher tourist-season demand against lower disposable income.
2017 to today — what changed
Three structural forces explain the rise from the 2017 baseline:
- Excise + VAT increases. Several EU members tightened fuel taxation in the late 2010s to fund green-transition budgets. The Netherlands raised excise on petrol by ~€0.10/L between 2018 and 2024; Germany’s CO2 levy on transport fuels began in 2021 and ratcheted annually.
- The Russian-supply shock. Sanctions following the February 2022 invasion of Ukraine removed Russian crude and refined-product imports from western European refining baselines, forcing a re-routing through Middle Eastern and US Gulf Coast suppliers at higher delivered cost.
- EUR weakness against the dollar. Oil is priced in USD; a weaker euro means more euros per barrel even when the dollar price stays flat. The EUR/USD rate has spent most of 2022–2026 in a range that adds 8–15 % to euro-denominated pump prices versus the 2017–2019 baseline.
The eastern–western spread has actually widened since 2017. Where Norway used to be roughly 3× the price of Belarus, the modern Netherlands-to-Malta spread runs about $4.50/gallon — a wider absolute gap, narrower in percentage terms, but more visible to an American comparing US prices to Europe.
©2026 Beverly Newman, Ed. D. All rights reserved.
Leave a Reply
Want to join the discussion?Feel free to contribute!