President Trump cuts number of bureaucrats attending UN annual event saving taxpayer dollars

The United Nations holds its fall general assembly in September.  This is when ‘diplomats’ from all over the world come to New York for really what amounts to one big party on the town.

Here we learn that to save money, the Trump Administration will be limiting the number of State Department and other DC bureaucrats who will be attending the confab on the taxpayers’ dime.It is also a time when the UN has an opportunity to bash America (except for when Obama was prezsident).

Not mentioned here, but just a reminder to readers, September will be the time of  Trump’s big test on the UN/US Refugee Admissions Program because according to the Kennedy/Carter Refugee Act of 1980, the President submits his annual ‘determination’ for the upcoming fiscal year to Congress.

Just about the time Trump speaks to the UN, he will have determined how many refugees will be admitted in the year beginning October 1 for FY18, and from what regions of the world they will come.

From AP at the Democrat Gazette:

The State Department plans to scale back its diplomatic presence at this year’s annual United Nations gathering of world leaders in September as a cost-saving initiative, according to four well-placed diplomatic sources. [Those leakers again?—ed]

For more than seven decades, American presidents from Harry Truman to Ronald Reagan to Barack Obama have attended the fall U.N. General Assembly general debate in New York to project their vision of American foreign policy to the world. They have been accompanied by a growing entourage of American diplomats, lawyers and technical experts who negotiate a wide range of issues, from nuclear arms treaties to climate change pacts and conflicts.

But the ranks of professional diplomats, aides and officials who attend the event to promote American policy priorities on a range of issues will be thinned out. For now, it remains unclear precisely how large of a cut in U.S. staff is envisioned, but two officials said the State Department is seeking to keep a ceiling down to about 300 people, including everyone from the president to support staff who schedule meetings and copy speeches.President Donald Trump does plan to address other world leaders at the U.N. General Assembly, and he will be accompanied by other top advisers, including his son-in-law, Jared Kushner, and his daughter Ivanka Trump, who stopped by U.N. headquarters Friday for a private lunch with U.N. Secretary-General Antonio Guterres.

[….]

The diplomatic culling is being enforced by Tillerson, the former ExxonMobil chief who has shown little interest in U.N. diplomacy during his first six months on the job. It comes at a time when the White House is seeking as much as a 30 percent cut in U.S. funding to the State Department and even deeper cuts in U.N. operations.

More here.

Will Donald Trump seek to cut the State Department budget by 30%? Will he cut even deeper in to the pile of money we give the UN? And, will he cut refugee numbers and seek to abolish or reform the UN/US Refugee Admissions Program? 

Answers will come in September!

Your job is to let the President know what you think on a daily basis!  Click here.

RELATED ARTICLES: 

Australia welcoming Syrian Christian refugees….

Canada’s Trudeau-Backed $10.5 Million Payment to Jihadist Facing Court Challenge

STUDY: Term Limited States Ranked Best Fiscally as Career Politicos Flop

Surprise, surprise. A brand new report says states with term-limited legislatures are outperforming their career politician counterparts.

According to George Mason University’s “Ranking the States by Fiscal Condition 2017” report, 8 of the 15 fiscally strongest states have legislative term limits. When one considers that only 15 out of 50 states have legislative term limits, this means citizen lawmakers are providing a quality of leadership disproportionately better than their peers.

The report’s criteria included five separate measures of solvency, which is a state’s ability to pay its short-term and long-term bills.

Florida, which has more term limits than any other state, was ranked as number one fiscally healthy state in America. For any state, the presence of term limits more than doubled the odds of receiving an elite ranking. None of the five worst-ranked states have legislative term limits.

So, what can we take away from this? First, this report dismantles the clichés that self-seeking politicians have always used to oppose term limits. For years they’ve warned that term limits would lead to inexperience which would produce fiscal ruin. This report proves the opposite is true – that term limits states do better than those run by prehistoric politicians.

As U.S. Term Limits has noted for years, real life experience – like running a business or being a teacher – gives lawmakers a better perspective than the political experience of cutting deals with lobbyists and raising cash for re-election. Career politicians are at best ineffective and at their worst, corrupt.

For evidence of this, look no further than the state ranked 49 on this list, Illinois. Illinois, which has no term limits, just made Representative Michael Madigan the longest serving legislative leader in American history. Madigan has been House Speaker for 32 of the last 34 years.

But Madigan’s vast experience has only plunged his state into fiscal calamity. Just last month, ratings agencies Moody’s and S&P dropped the state’s bonds to BBB-, the lowest rating ever for a state. The raters said if Illinois doesn’t do something about its $200 billion in long-term debt, the bonds will be downgraded to junk.

Madigan has been able to get himself and other careerist politicians re-elected in perpetuity, but he hasn’t lifted a finger to solve the state’s fiscal woes. And therein lies the problem with having no term limits.

Individuals elected under a term limits system know their job is not to build political empires. It’s to get in, solve problems, then return to private life.

If these rankings are any indication, term limits are doing a great job.

Catholic Bishops & Lutherans lament not enough U.S. taxpayer funded refugees coming in to pay their bills

No of course they didn’t say it that way, but that is what they mean.  Instead, once again, it is about the poor refugees left in the lurch in some third world hell hole because of that meany Donald J. Trump.

This is a broken record alert, but I plan to continue to pound the issue of payment to contractors being tied to the number of refugees admitted, so there is never a reasonable discussion about any slowdown or reform of the UN/US Refugee Admissions Program.

If they were paying for their Christian ‘charity’ out of the pockets of good and kind-hearted parishioners, I would have nothing to say. But, until the USCCB admits to the media that they receive 97% of their annual migration fund budget (about $83 million in 2014) from taxpayers, I will be a broken record on the issue.

It was only six days ago I did a new accounting report for the nine federal refugee contractors*** quasi-government agencies that monopolize all resettlement in the US.

Both the Bishops and the Lutheran contractor are 96-97% funded by US taxpayers!

You will never know that by reading this news.  Indeed, Charity Navigator, a service that rates charities to help you decide if you want to give, said this about LIRS (they would have said the same about the USCCB except that outfit doesn’t file a Form 990, that we can find).

This organization is not eligible to be rated by Charity Navigator because, as a service for individual givers, we only rate organizations that depend on support from individual contributors and foundations. Organizations such as this, that get most of their revenue from the government or from program services, are therefore not eligible to be rated.

In this story from Crux (a Catholic publication) we learn that Catholics and Lutherans are #1 and #2 in the number of refugees they drop off in American towns and cities.

Here is Crux (lamentations):

WASHINGTON, D.C. – Amid a federal judge ordering the government to broaden the exemptions to the immigration travel ban partially upheld by the Supreme Court, Catholic and Lutheran leaders lamented that the immigration cap had been reached for refugees without such exemptions for the 2017 fiscal year.

The federal government suspended travel July 12 for refugee immigrants without close family connections after confirming that 50,000 refugees – the limit imposed by President Donald Trump in a March 6 executive order – had arrived on U.S. soil.

“We remain deeply troubled by the human consequences of the revised executive order on refugee admissions and the travel ban,” said Bishop Joe S. Vasquez of Austin, Texas, chairman of the U.S. bishops’ Committee on Migration, in a July 13 statement.

“Resettling only 50,000 refugees a year, down from 110,000, does not reflect the need, our compassion, and our capacity as a nation,” Vasquez added. “We have the ability to continue to assist the most vulnerable among us without sacrificing our values as Americans or the safety and security of our nation.” [Be sure to see my post on the ceilings going back 30 years, here.  Note that Obama got no where near 110,000 until he was virtually walking out the door, now that has become the standard measure!—ed]

William Canny, U.S. Conference of Catholic Bishops’ lobbyist in Washington, D.C.

“The pause on resettlement and restrictions on the number of persons who can enter our country as refugees will have an immediate effect on our ability to conduct the lifesaving work of providing safety and protection,” said a July 12 statement by Kay Bellor, vice president for programs of Lutheran Immigrant and Refugee Service, which is second only to the U.S. bishops’ Migration and Refugee Services in the number of refugees it helps resettle in the United States.  [Yes, it will have an immediate effect because your organization raised virtually NO PRIVATE MONEY!—ed]

[….]

“As Bishop Vasquez said, it’s very sad, deeply troubling,” MRS executive director William Canny told Catholic News Service July 14.

Pushing for 75,000 refugees in FY18!

At least they have tempered the demand for 200,000 they made of Obama for his last year. If Trump admits 75,000 he will be about 10,000 above the average admissions for the last ten years (which included their dear leader’s years).

Crux continues….

“What we’re advocating for is 75,000” refugees to come into the United States during fiscal 2018, Canny told CNS. “We understand that the administration has security concerns. The administration made some initiative to reduce the number of refugees coming into the country. We don’t agree with it, so at a minimum, we think we should be bringing in 75,000.”

Bellor agreed with the 75,000 figure, noting the number is “less than the need.” Citing United Nations World Refugee Day figures, “the numbers are definitely not shrinking,” she said. “The number of people on the move is 66 million.”

LOL! 75,000 must be the point where they can keep their budgets plenty full with your money!

There is more at Cruxgo here to read it all.

Come on all of you (not just the Lutherans and the Catholics), admit that your ‘charitable’ work with refugees could not happen without a huge infusion of more than a half a billion $ a year in federal funding.

And, come on mainstream media, it is time you told the truth!

***Federal contractors/middlemen/lobbyists/community organizers paid by you to place refugees in your towns and cities.  Because their income is largely dependent on taxpayer dollars based on the number of refugees admitted to the US, the only way for real reform of how the US admits refugees is to remove the contractors from the process.

RELATED ARTICLES: 

The 20 diseases ‘refugees’ bring into the West

Australia “dumb deal” looks dead for now

Hetfield of the Hebrew Immigrant Aid Society thinks Hawaiian judge just opened floodgates

New Hampshire: Congolese refugee escapes prosecution in domestic violence case

Hawaiian rogue judge has until Tuesday to respond to Trump SCOTUS motion

The Walmart Guy vs Anti-Capitalism Millennials

Though we have never met, I smiled recently seeing my favorite Walmart employee. For over ten years, I witnessed him gathering shopping carts in the parking lot. He is a white millennial who only has the use of one arm, walks with a severe limp and appears slightly mentally challenged. I once saw him leaving work driving a new looking compact car. My wife Mary prepared his taxes when she worked for a tax preparation company. I thought, “Hey, this brother has got it goin’ on — doin’ his thing.”

The Walmart guy could easily qualify for disability; sit home on his butt allowing taxpayers to take care of him. Far too many able-bodied millennials feel entitled, believing government should provide them free everything.

The Walmart guy’s work-ethic, self-reliance and pride in earning his own way is truly refreshing. The Obama Administration practically begged Americans, even non-citizens, to get on food stamps and to apply for as many government freebies as possible. This addicts voters to government handouts and keeps them voting for their Democrat dealers. Disability claims skyrocketed under Obama.

Disturbingly, polls say a majority of millennials reject Capitalism. They believe Socialism is fair and compassionate and Capitalism is selfish and cruel. This explains “yutes” hero worship of socialist/democrat presidential candidate Bernie Sanders. Millennials love Sanders’ promise to take the hard earned wealth of achievers to redistribute to lazy pot-smoking losers. Former British Prime Minister Margaret Thatcher said, “The trouble with Socialism is that eventually you run out of other people’s money.”

Socialism always ends up spreading mediocrity and misery equally among the masses while the rulers live high on the hog. Have you noticed that Hollywood Leftists and socialist politicians want government to force us to drive tiny tin-can cars, surrender our guns and lower our carbon footprint? Meanwhile, they travel in gas-guzzling limos and private jets with armed guards.

Capitalism gives everyone a shot at achieving their American dream. I will slap the next fellow black person who whines to me about how whitey has stacked the deck again us. Capitalism birthed America’s first female millionaire, a black woman born in 1867. Madam C. J. Walker was an entrepreneur, philanthropist, and a political and social activist. Socialism would have enslaved Madam Walker to the government system, giving her just enough free stuff to get by. Okay, I promise not to slap anyone.

It was depressing hearing it reported that a large number of Americans support taxing income over a million dollars at 100%. First of all, confiscating that money would generate around $616 billion which only covers a third of our annual deficit.

But what is most troubling is the disgusting class envy loser mindset of those who believe it is right for government to take people’s hard earned money. They do not realize that such financial tyranny would kill jobs and the incentive to be all one can be. How dare government place limits on success. Such thinking is un-American, counter to our God inspired founding.

We allowed Leftists’ silent-coup-takeover of public education decades ago. Consequently, Leftists have produced an army of stealth Leftist sleeper-cell operatives against their parents. Remember when Leftists instructed kids to steal their parent’s guns and turn them in to their teachers? Remember Michele Obama instructing students to report politically incorrect speech at the dinner table?

Outrageously, white students are taught beginning in kindergarten that they were born racist. In essence, white students are taught to feel ashamed and hate themselves for their unfair white privilege. The Walmart guy is on Leftists’ excrement list simply for being a working class white male. It angers me envisioning Leftist bullies getting into the grill of my Walmart guy, scolding him about his evil white privilege.

Students support black college student’s demand for free tuition and housing.

Black students also expect academic and behavioral standards lowered for them. I’m a 68 year old black man. I would be highly offended having standards lowered for me. Millennials quickly embrace Leftists twisting everything into evidence of unfairness and white American racism.

Years ago, a white friend shared that her son came home from middle-school in tears about how white men abused everyone; blacks, women, native Americans and so on. Today her son is an America hating Communist who still believes European white men are the greatest source of evil in the world.

Folks, we much turn this mess around regarding Leftists’ indoctrination of our kids. Trump appointing Betsy DeVos as Secretary of Education is a major step in the right direction. DeVos favors restoring power back to parents regarding the education of their children.

Oh, we’re out of milk. I’m confident I will see my Walmart guy diligently working.

The Real Reason Government Wastes So Much Money by Daniel J. Mitchell

Why does government waste so much money? In so many ways? With such reckless abandon?

I suppose I could answer with mockery and say it’s because they have lots of experience squandering our tax dollars.

But let’s seriously contemplate that question and explore one of the reasons for waste. Simply stated, government programs are a magnet for scammers.

Let’s look at three case studies.

Example #1: Fraud is an inherent part of the big entitlement programs. Kevin Williamson has some unseemly details in an article for National Review.

…you know where there’s a lot of waste, fraud, and abuse? Social Security, Medicare, and Medicaid. …Medicare and Medicaid together account for about $1 trillion in federal spending annually, and estimates suggest that $1 out of ever $10 of that spending is fraud. Some estimates go much higher. We do not have a very good idea of exactly how extensive fraud in the system is, because the federal government has put a fair amount of effort into not knowing.

And what does that mean? How does the government try not to know?

…the government’s approach long has been backward…investigators are asking whether a certain treatment was in fact appropriate for what ails Mrs. Jones, not whether Mrs. Jones exists.

In other words, bureaucrats basically accept all claims as legitimate and simply judge from afar whether the right medical service is provided for the listed ailment.

Even if the ailment is fictional. Or the patient is fake.

As one might imagine, that kind of sloppy approach, combined with programs that dispense hundreds of billions of dollars, is a magnet for professional crooks.

It’s the work of organized crime. As Sparrow points out, when there is a criminal case filed against one of these fraud artists, then billing in a particular category – some years ago, it was HIV fusion treatments – falls off steeply, by as much as 90 percent. The implication here is that fraudulent billing may make up the majority of Medicaid and Medicare spending in some categories. …organized-crime syndicates are being permitted to use our medical entitlements to loot the Treasury, and that not very much is being done about that, which suggests the possibility – only a possibility – that there is political collusion in this at some level.

By the way, Kevin may be on to something when he speculates about collusion.

We already know about examples of politicians intervening to protect fraudsters

(who, conveniently, also happen to be campaign donors).

So is it really that much of a stretch to imagine them turning a blind eye (or worse) to industrial-level fraud by criminal enterprises?

Leads me to think this cartoon makes an unnecessary distinction.

Example #2: Welfare programs also are a magnet for fraud.

Here are excerpts from a recent news report.

Another six Lakewood, New Jersey couples were charged Wednesday with welfare fraud, bringing to 26 the number of people implicated since last week in the multimillion-dollar scandal. At the heart of the charges is the allegation that they all, in one way or another, failed to report or otherwise concealed significant income that would have made them ineligible for the assistance programs in which they enrolled. In total, state and federal prosecutors have said the families collected more than $2.4 million in benefits. …They allegedly obtained nearly $400,000 in Medicaid, food and heating benefits fraudulently. …Four other couples were arrested June 26 for allegedly defrauding public assistance programs of more than $1.3 million in benefits.

Welfare fraud must have been a major pastime for residents of the town.

Hundreds of these moochers are now trying to cover their tracks in hopes of avoiding legal trouble.

The specter of more charges has shaken Lakewood. Hundreds of residents have contacted authorities seeking amnesty or help avoiding arrest, the Asbury Park Press reported on June 29. In addition to the hundreds seeking amnesty, dozens more people have contacted social service agencies to cancel their benefits or declare income.

Example #3: And nobody should be surprised to learn that there’s plenty of fraud at the Pentagon.

Here’s an example that seems very representative.

The former owners of a Pittsburgh-area military supplier have been accused of defrauding the U.S. government of more than $6 million in defense contract work. …Prosecutors allege the Buckners inflated the cost of the work by falsifying invoices to make it appear as though they had spent $70 per window frame for the materials when in fact they had paid just $20 each for frames manufactured in China. The brothers are also alleged to have sold scrap aluminum collected in the manufacturing process without crediting that money to TACOM. The losses to TACOM are placed at $6,085,709 by the DOJ.

But that’s just the tip of the iceberg.

In 2014, a defense contractor responsible for providing food and water to troops in Afghanistan pleaded guilty to over-charging the U.S. government to the tune of $48 million. This week, two San Diego defense contractors pleaded guilty in a scheme that defrauded the Navy out of at least $1.4 million by over-billing for supplies that the military never ordered, the San Diego Union-Tribune reported. Similar stories have cropped up in Florida, California, Maryland, North Carolina and elsewhere in recent years, renewing calls for systemic reforms.

Maybe the reason fraud is so pervasive is that penalties are trivial or nonexistent.

A 2011 DOD report found hundreds of defense contractors that defrauded the U.S. military subsequently went on to receive more than $1.1 trillion in new Pentagon contracts between 2000 and 2010.

Shouldn’t criminal companies be barred from subsequent contracts? Shouldn’t crooked company officials be sent to prison?

Or do these things not happen because the same folks are also campaign contributors?

I don’t know the answer to these questions, but surely something is amiss. It’s almost as if government is simply a racket for the benefit of insiders.

Reprinted from International Liberty.

Daniel J. Mitchell

Daniel J. Mitchell

Daniel J. Mitchell is a senior fellow at the Cato Institute who specializes in fiscal policy, particularly tax reform, international tax competition, and the economic burden of government spending. He also serves on the editorial board of the Cayman Financial Review.

RELATED ARTICLE: As a Teen Cashier Seeing Food Stamp Use, I Changed My Mind About the Democrat Party

Refugee resettlement contractors 57% to 98% funded by U.S. taxpayers

I hadn’t checked the most recent data on how much of your money goes to the nine federal refugee resettlement contractors (aka VOLAGs) lately.  So here is the latest information I could find. I had to use several sources mostly because some contractors do not file a Form 990 (They claim they are churches and are thus exempt).

Unfortunately I couldn’t find all income information for all nine for the same year, so it is a little hard to make a direct comparison, but you get the idea.

These are the nine major federal resettlement contractors.  (Go here to see a data base with the hundreds of subcontractors working for them in a town near you.)

Church World Service (71% funded by taxpayers)

Church World Service as of June 2016 had a total revenue for the previous year of $88,455,527.

71.3% of their millions comes from you—the taxpayer—according to Charity Navigator, here. You are the source of government grants:

Their chief executive, Rev. John McCullough makes an annual salary of $251,224.

Ethiopian Community Development Council (93% funded by taxpayers)

ECDC is not rated at Charity Navigator so I had to use their most recent Form 990, see here.

(If you have trouble opening the Form 990, go here and then download the document.)

Their total revenue for the year ending September 30, 2014 was $17,448,992. You will see on page 9 that they received $16,290,580 in government grants making them 93% funded by you, the taxpayer.

ECDC’s President Tsehaye Teferra has income listed on page 7 in three columns. The first is direct compensation of $171,683 and the two other columns involve other  income from this organization and from “related” organizations of $57,857 and $46,843 (don’t ask me what that is!).

Episcopal Migration Ministries (aka Domestic and Foreign Missionary Society of the Episcopal Church) (99.5% funded by taxpayers)

We know they are 99.5% funded by you because they admitted it here.  But, because their federal funds flow in to a church ‘kitty’ and because churches don’t file Form 990’s (or most churches don’t), we have no idea how much they are getting or what the program leaders are being paid.  Frankly, this is shameful!

If you are of the Episcopal faith, you need to start asking questions!

Hebrew Immigrant Aid Society (aka HIAS) (57% funded by taxpayers)

According to Charity Navigator for the year ending 12/2015, HIAS had a total revenue of $40,565,891.

Chief executive Mark Hetfield‘s annual salary in that report is $358,718.

International Rescue Committee (66.5% funded by taxpayers)

Be sure to focus on how much bigger the IRC is with an annual revenue of $688,920,920! From Charity Navigator:

66.5% is in the vicinity of $455 MILLION of your dollars annually!

Head honcho David Miliband hit the jackpot with this annual salary: $591,846!

US Committee for Refugees and Immigrants (USCRI) (98% funded with taxpayer dollars)

USCRI is a little harder to figure out. Charity Navigator does not rate them for this reason:

This organization is not eligible to be rated by Charity Navigator because, as a service for individual givers, we only rate organizations that depend on support from individual contributors and foundations. Organizations such as this, that get most of their revenue from the government or from program services, are therefore not eligible to be rated.

You could say that USCRI is a quasi-government organization masquerading as a non-profit!

Lavinia Limon (left)

So we go to the most recent Form 990 available for year ending September 30, 2015.  (Or download PDF at ProPublica, here)

On page 9 you can see that they only take in less than $1 million of their $51,524,570 from private gifts and contributions. All of their “program income” is likely through taxpayer dollars as well.

President and CEO Lavinia Limon makes $260,258 in annual compensation plus pulls down another $42,231 from this and related organizations (whatever that is!).

NOTE: We have a lot on Lavinia Limon here at RRW. She was Bill Clinton’s director of the ORR!

Lutheran Immigration and Refugee Service (LIRS) is 96-97% funded by taxpayers

Like USCRI it’s a little hard to figure out, from their recent Form 990 here where their total income is $55,983,615, exactly which of the fees in their income column actually are taxpayer dollars too.

We can assume there isn’t much private charity going to LIRS because Charity Navigator says the same thing they did for USCRI which is:

This organization is not eligible to be rated by Charity Navigator because, as a service for individual givers, we only rate organizations that depend on support from individual contributors and foundations. Organizations such as this, that get most of their revenue from the government or from program services, are therefore not eligible to be rated.

Hartke (blue jacket front row picture right) with refugee lobbyists last month.

Just a reminder that USCRI and LIRS are really quasi-government agencies yet they are busy lobbying Congress and otherwise community organizing in order to influence the media and Congress to support more refugees (aka paying clients!) coming to America.

LIRS President and CEO Linda Hartke makes an annual salary of $274,632 and an additional $33,401 from this and related organizations (page 8).

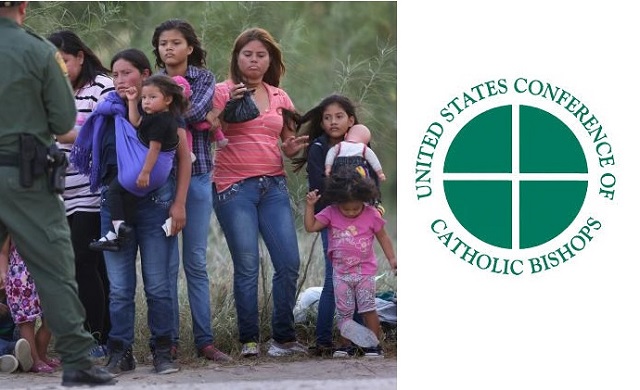
US Conference of Catholic Bishops Migration Fund (97% taxpayer funded)

Now it gets even trickier! The Bishops don’t file a Form 990 and their operations are so vast, I could spend the whole day and still not sort it out.  Also, maybe you can find one, but I have not found an annual report for their refugee program since I found this one for 2014.

So we will have to rely on it (again). Keep in mind these funds for their refugee resettlement program do not include millions that go directly from the feds to some individual Catholic Charities and Dioceses around the US. (If you are researching your local CC or Dioceses, you can often find good numbers at USASpending.gov)

“Federal grants” is your money, so is the Travel Loan Collection Fees, so that puts the Bishops’ refugee resettlement program at 97% taxpayer funded.  (I am not sure if the Unaccompanied Alien Children fall in to yet another fund!).

I would like to get a more up-to-date accounting for the Bishops, but they must be hiding those reports really well!  I suspect they are pulling down even more payola in more recent years.

Obviously we don’t know what salaries are being paid for their Washington, DC lobbying shop. Their previous head lobbyist was Kevin Appleby.

World Relief (Corp. National Association of Evangelicals) is 72.8% funded by taxpayer dollars

That is according to Charity Navigatorhere.  Total revenue is $62,583,313 for the year ending September 30, 2015.  But, I did find a more recent Form 990here, with a huge jump in income in one year to $71,022,032.  I thought World Relief was broke and closing offices??? (Gives me an idea for another post and that is to report on some of the contractors increases in funding over several years).

That Form 990 shows something I hadn’t seen in other Form 990’s and that is that the Prez/CEO doesn’t make a whole lot, but some financial officer (Barry Howard) is making over $250,000 big ones (see pages 7 & 8).

Here is Charity Navigator’s “contributions” breakdown. Ha! Ha! your tax dollars for government grants are contributions!

Whew!  What a job searching for all that financial information! Hope you made it this far!

Can you see now why I say there will be no reform of the UN/US Refugee Admissions Program as long as these nine contractors, masquerading as charities, are sucking on the federal teat and bidding for bodies (aka refugee ‘clients’)?

And, adding insult to injury, they lobby, kiss up to the media, and community organize against you who are paying for the whole refugee racket!

None of these organizations would survive very long if Congress and the President cut them loose (or stated more kindly and so as not to mix metaphors!—weaned them!).

Your daily assignment! Write to the White House, here.

RELATED ARTICLE: The 20 diseases ‘refugees’ bring into the West

Tech is Drastically Disrupting Local Taxes — Can Government Respond? by Jim Ley

In 1994 I gave a speech to a large gathering at the National Association of Counties asking the question “Will You be Roadkill on the Information Superhighway?” The Internet as an everyday thing was new and just beginning to gain some relevance. But those of us who liked to look to the future saw a lot that was going to impact public policy.

On that day I asked them the simple question — how will you tax a box the size of your kitchen table (OK, be fair, file servers were a lot larger then, but I was looking to the future) that produces all of the sales transactions that used to be produced by your local mall — at the time the arguably largest single property tax generator in most urban counties?

I look back on that presentation and realize that as close as I was to defining a set of specific challenges that might take place, I wasn’t even in the ballpark of being able to see the systematic influence that technology would drive across the board.

I find it interesting that much of the policy discussion today regarding technology is centered on the theme of “coping with disruptive technology trends.” Just the use of the word “disruptive” to describe the challenge shows how difficult it is for government and society to identify and adapt to changes in the status quo. How tied to the status quo we can become!

The way of systemic adaptation

Amazon is now the large retailer in the world.

The online shopping experience, having started in 1995, has hit its stride and has become more a part of our everyday consuming life than we could ever have suspected. Online fulfillment companies like Amazon have evolved through multiple phases of connection with their customers and have now begun to address the subliminal emotional aspects of the shopping experience.

Within 10 years even more will change as regards the online shopping experience. You won’t have to shop, as in searching and then browsing through endless pages looking for what you want. Your desires will be presented to you directly, just like you have your own digital personal shopper. Your shopping experience will become the guide to anticipating your purchasing needs.

Your closet, pantry and refrigerator will tell your computer, and that of your online retailer, how old your clothes are, when you wore an item last, and what food staples you are in need of. Your purchasing habits, social media and on line habits will be mined to produce a customized shopping experience geared just to you. The local retail store will increasingly become a thing of the past, replaced by an outlet where you may be able to try out virtual goods or where you can have them delivered in the form of 3D printed consumables. With a personal shopping list having been organized for you without much thought on your part, the push of a button will bring your groceries and supplies to your door.

Other things will change as a result.

The commercial real estate market will begin to shrink, maybe even dramatically. The need for large and small strip malls will be greatly diminished, limited in some respects to places that house grocery stores — to the degree they will be needed as grocery needs can also be algorithmically anticipated — and small offices and boutique local retail.

Personal shopping automobile trips will, over time, be reduced dramatically, and more and more people will begin to abandon personal automobile ownership in favor of car sharing services that will evolve from the current Uber model to the point where you can simply call for a self-driving vehicle on your smartphone or similar device.

Automobile sales as the significant source of state and local sales tax revenue they now are will begin to decline under this scenario. Bulk delivery services like FedEx and UPS will be replaced with drones and Uber like personalized delivery. The Amazon-type fulfillment center will become the largest building in a region — until it too is made obsolete.

A radical impact on funding governments

All of this will radically transform the property tax base, with commercial space being devalued sharply. It is this commercial and office space in the shape of downtowns and dense (not suburban) clusters that, until now, has produced the large tax premium  — defined as producing taxes over and above the average per acre — that the rest of the community uses as a dividend to keep its public services funded at a sustainable level.

Maintaining a sustainable property tax base will become a topic at every City Council and County Commission meeting as the commercial tax base absorbs this “disruptive” result. The shape of communities will change, creating large opportunities for redevelopment, always with an emphasis on propping up the property tax base. A strategy of density oriented tax farming will become more obvious as a means of maintaining the flow of public revenue while limiting costs required to provide for the basics of public service. It will no longer be a question of what is the most valuable parcel in a county or city tax base (like “the mall”) but instead it will be all about the taxes generated per acre of development. Density, a dirty word used in land-use hearings today, will be the byword for financial survival.

Collectively these trends should work to influence land-use policy now and lead to a redefinition of urban space, their collective interaction producing the catalyst that moves the market back to a more walkable and intimate urban and suburban form in our activity centers.

The question is: Are the statehouses and local council chambers that set the policies that manage our communities capable of identifying these trends and managing the political discussions and decisions required to adapt? What principle will be applied in attempts to cope? Will it be a principle of regulate-and-control that protects the status quo, or a principle of identify-and-adapt, seeking to engage and inform investment and real estate interests who themselves will have to adapt or perish?

The states and cities that can think forward like the Amazons and Apples of the private sector, will be in position to thrive in the new economy. The rest…

EDITORS NOTE: This column originally appeared on The Revolutionary Act.

Social Democracy Didn’t Spur Post-War Growth by Tim Worstall

It is obviously going to be difficult to get an economic idea across to Owen Jones – the lad’s a socialist for goodness sake, one who praised Venezuela’s policy loudly for some years – but needs must, eh?

In his latest Guardian column, he tells us that Clem Attlee’s government produced the social democratic nirvana powering post-war growth:

That model – public ownership, high taxes on the rich, strong trade unions – delivered an unparalleled increase in living standards and economic growth. A surge in oil prices, and the collapse of the Bretton Woods international financial framework, helped bring that era to an end.

No, this is not how it worked. That post-war growth was coincident with those policies, as well as other controlling measures such as needing government permission to take your own money out of the country. But they were not the cause of the growth.

One useful hint here is that the burst of growth came in many countries at the same time despite those countries deploying a variety of economic policies. Hong Kong grew using the closest thing to laissez faire in modern times. Sweden was notably more market liberal than the UK in these years and Sweden grew.

It is also remarkably difficult to work out why those policies would, or even could, promote growth. Redistribute it, yes, but cause it? How?

A Flawed Model

Jones’s second point – that the model failed because Bretton Woods fell – is also wrong. The model’s fall was because of the model’s flaws.

So, if it wasn’t economic policy which caused the Glorious 30, as the French call it, then what was it? The absence of economic growth in the preceding two odd decades.

It is a standard of the economic literature that catch-up growth is easier than trying to work out what to do at the technological cutting edge. Bangladesh and India are growing at 6 and 8 percent a year these days mostly because the technologies they need already exist.

Working out how to do the new stuff is much harder and is part of the reason why rich nations struggle along at 2 and 3 per cent growth if they’re lucky.

At which point we should note that there just wasn’t much economic growth post-1929. We can’t use the war years themselves. GDP statistics compiled out of making things to then either be sunk or blown up after sinking or blowing up other things, aren’t a reliable guide to anything other than the ability to sink or blow things up.

It would take a very special level of delusion to try and insist that living standards were higher in 1945 than 1939, whatever the economic statistics say about gross production. And there wasn’t much growth in the period from 1929 to 1939 either. Britain did better than the US largely by devaluing and not bothering with any of the New Deal nonsense. The American performance over that period produced no cumulative net growth at all.

However, and here’s the important part, the technological advance continued apace. Here’s an example of the sort of plane Grandpa crashed in 1928, here’s what he was waving off his airfield in 1945. And in 1950 we’d not really exploited fully the automobile, electricity or transistor, let alone jet aircraft.

And that’s the secret of that post-war growth: there wasn’t much of it in the earlier decades, but technology had continued to move on. Meaning that the economies of almost all nations were inside the technological envelope where growth is much easier.

The Market Approach Produced Better Performance

We have one more proof of the insistence that it wasn’t those taxes, unions and public ownership which produced the growth. For Germany’s performance was rather better than that of Britain. And Germany’s economy was egged on by Ludwig Erhard, using a much more market-liberal approach. He was a member of the Mont Pelerin Society, the fount of Hayek and the sort of neoliberalism that drives us at the Adam Smith Institute.

Contrary to Jones’s claim, a less socially democratic and statist set of policies produced a better result. It isn’t, therefore, social democracy that produced the growth. In fact, statist policies hindered it.

Attlee’s controls upon the economy were coincident with good growth, not the cause of it. And that good growth isn’t going to return by bringing back the controls.

We need either a really good depression followed by a war to have those decades of above average growth or, by preference, more of that market liberalism which drove Germany’s outperformance at the time.

Reprinted from CapX.

Tim Worstall

Tim Worstall

Tim is a Fellow at the Adam Smith Institute in London

Which State Is Most Dependent on Government? by Daniel J. Mitchell

Red State, Blue State, Independent State, Moocher State: I don’t know if Dr. Seuss would appreciate my borrowing from his children’s classic but given how I enjoy comparative rankings, I couldn’t help myself after perusing a new study from WalletHub that ranks states on their independence (or lack thereof).

Ranking the States

Being a policy wonk, what really caught my attention was the section on government dependency, which is based on four criteria.

As you can see, the four factors are not weighted equally. The “federally dependent states” variable is considered four times as important as any of the other variables.

That’s important, to be sure, but is it really more important (or that much more important) than the other categories?

Moreover, I’m not sure the “tax freedom day” variable is a measure of dependency. What’s really captured by this variable, given the way the tax code doesn’t tax low-income people and over-taxes high-income people, is the degree to which states have lots of rich people or poor people. But that’s not a measure of dependence (particularly if the rich people stole money instead of earning it).

But I’m quibbling. I might put together a different formula with some different variables, but WalletHub has done something very interesting.

Most Independent States

And if we look at their 25 least-dependent states, you see a very interesting pattern. Of the 10-most independent states, only three of them are Trump-voting red states (Kansas, Nebraska, and Utah).

The other seven are blue states. And some of them – such as Illinois, New Jersey, and California – are dark blue states. And the #11 and #12 states also were Hillary states as well.

Which raises an interesting question. Why are voters in those states in favor of big government when they don’t disproportionately benefit from handouts?

Are they culturally left-wing, putting social issues above economic issues?

Or are they motivated by some issue involving foreign policy and/or defense?

Or maybe masochistic?

Beats me.

By the way, the WalletHub email announcing the report included a very interesting factoid that may explain why Hillary lost Pennsylvania.

Pennsylvania has the lowest percentage of government workers (local, state and federal), at 10.8 percent. Alaska has the nation’s highest percentage, at 25.1 percent.

Though I can’t see those details in the actual report, which is disappointing. I’d like to see a ranking of the states based solely on the number-of-bureaucrats criteria (we have data comparing countries, for those interested).

Now let’s shift to the states that have the highest levels of dependency.

Least Independent States

If you look at the bottom of the final image, you’ll notice that it’s a reverse of the top-10. Seven of the most-dependent states are red states that voted for Trump.

Only New Mexico, Oregon, and Maine supported Hillary (and Trump actually won one-fourth of Maine’s electoral votes).

So this raises a separate question. Are red state people voting against their interests? Should they be voting for politicians who will further expand the size and scope of government so they can get even more goodies from Uncle Sam?

For what it’s worth, a leftist actually wrote a book entitled What’s the Matter with Kansas, which examined why the people of the Sunflower State weren’t voting for statism.

Well, part of the answer may be that Kansas is one of the most independent states, so perhaps the author should have picked another example.

But even if he had selected Mississippi (#49), I suspect the answer is that low-income people don’t necessarily think that it’s morally right to steal money from other states, even if the loot is laundered through Washington.

In other words, people in those states still have social capital or cultural capital.

Demographics and Redistribution

It’s also possible, of course, that voters in red states with lots of dependency (at least as measured by WalletHub) are instead motivated by cultural issues or foreign policy issues.

There’s even a very interesting study from Professor Alesina at Harvard, which finds that ethnically diverse jurisdictions can be more hostile to redistribution (and homogeneous societies like the Nordic nations are more supportive of a large welfare state).

And since many of the red states at the bottom of the rankings also happen to be states with large minority populations, perhaps that’s a partial explanation.

Though California has a very large minority population as well, yet it routinely votes for more redistribution.

The bottom line is that we probably can’t draw any sweeping conclusions from this data.

Though it leaves me even more convinced that the best approach is to eliminate all DC-based redistribution and let states decide how much to tax and how much to spend. In other words, federalism.

P.S. I put together my own ranking of state dependency, based on a formula involving welfare usage and poverty. Vermont was the worst state and Nevada was the best state.

P.P.S. I also shared calculations based solely on the share of eligible people who signed up for food stamps. Interestingly, Californians rank as the most self-reliant. Maybe my predictions of long-run doom for that state are a bit exaggerated.

Reprinted from International Liberty.

Seattle’s Minimum Wage Has Been a Disaster, as the City’s Own Study Confirms by Alex Tabarrok

The Seattle Minimum Wage Study, a study supported and funded in part by the Seattle city government, is out with a new NBER paper evaluating Seattle’s minimum wage increase to $13 an hour and it finds significant disemployment effects that on net reduce the incomes of minimum wage workers. I farm this one out to Jonathan Meer on FB.

This is the official study that was commissioned several years ago by the city of Seattle to study the impacts of raising the minimum wage, in a move that I applauded at the time as an honest and transparent attempt towards self-examination of a bold policy. It is the first study of a very high city-level minimum wage, with administrative data that has much more detail than is usually available. The first wave (examining the increase to $11/hr) last year was a mixed bag, with fairly imprecise estimates.

These findings, examining another year of data and including the increase to $13/hr, are unequivocal: the policy is an unmitigated disaster. The main findings:

– The numbers of hours worked by low-wage workers fell by *3.5 million hours per quarter*. This was reflected both in thousands of job losses and reductions in hours worked by those who retained their jobs.

– The losses were so dramatic that this increase “reduced income paid to low-wage employees of single-location Seattle businesses by roughly $120 million on an annual basis.” On average, low-wage workers *lost* $125 per month. The minimum wage has always been a lousy income transfer program, but at this level you’d come out ahead just setting a hundred million dollars a year on fire. And that’s before we get into who kept vs lost their jobs.

– Estimates of the response of labor demand are substantially higher than much of the previous research, which may have been expected given how much higher (and how localized) this minimum wage is relative to previously-studied ones.

– The impacts took some time to be reflected in the level of employment, as predicted by Meer and West (2016).

– The authors are able to replicate the results of other papers that find no impact on the restaurant industry with their own data by imposing the same limitations that other researchers have faced. This shows that those papers’ findings were likely driven by their data limitations. This is an important thing to remember as you see knee-jerk responses coming from the usual corners.

– You may also hear that the construction of the comparison group was flawed somehow, and that’s driving the results. I believe that the research team did as good of a job as possible, trying several approaches and presenting all of their findings extensively. There is no cherry-picking here. But more importantly, without getting too deep into the econometric weeds, my sense is that, given the evolution of the Seattle economy over the past two years, these results – if anything – *understate* the extent of the job losses.

This paper not only makes numerous valuable contributions to the economics literature, but should give serious pause to minimum wage advocates. Of course, that’s not what’s happening, to the extent that the mayor of Seattle commissioned *another* study, by an advocacy group at Berkeley whose previous work on the minimum wage is so consistently one-sided that you can set your watch by it, that unsurprisingly finds no effect. They deliberately timed its release for several days before this paper came out, and I find that whole affair abhorrent. Seattle politicians are so unwilling to accept reality that they’ll undermine their own researchers and waste taxpayer dollars on what is barely a cut above propaganda.

I don’t envy the backlash this team is going to face for daring to present results that will be seen as heresy. I know that so many people just desperately want to believe that the minimum wage is a free lunch. It’s not. These job losses will only get worse as the minimum wage climbs higher, and this team is working on linking to demographic data to examine who the losers from this policy are. I fully expect that these losses are borne most heavily by low-income and minority households.

Reprinted from Marginal Revolution

Alex Tabarrok

Alex Tabarrok

Alex Tabarrok is a professor of economics at George Mason University. He blogs at Marginal Revolution with Tyler Cowen.

RELATED ARTICLE: Congress’ Inaction on Trump’s Agenda Costs America Nearly 1,000 Jobs Per Day

Florida Ranks 33rd on Best Places to Make a Living List

Governor Rick Scott, the Florida Congressional delegation and the Florida legislature has been touting how many jobs have been created in the Sunshine state. As we have written jobs are not created by government, rather a job is created by one thing only, a profit. Allow companies to make a profit and that company will hire more people to meet demand. The question is are we creating jobs that allow our workers to make a living? A good living?

Government can help companies by cutting their taxes, reducing the regulatory burden on companies and get government out of the way of entrepreneurs.

But more is needed. New research gives Florida, and each state, an idea of the quality of jobs created in their state in 2017. Many of our contributors have argued that Florida needs to diversify its job market and attract high paying jobs. Florida’s job market is built on sand, with the majority of workers in service industries. Tourism, agriculture and construction are the top three job creators. What Florida lacks is high paying jobs in manufacturing, energy exploration, and high tech industries. A recent study shows why Florida must look beyond tourism, agriculture and construction.

Richard Barrington, Senior Financial Analyst MoneyRates.com, in an article titled, Best Places to Make a Living: MoneyRates.com Ranks the Top States wrote:

This nation has come a long way since the Great Recession, but some state economies are coming ahead farther than others. Unemployment nationally is down below 5 percent, and wages are finally starting to rise.

However, some states are grappling with unemployment rates more than twice as high as in others. The highest-paying states have median wages that are about $15,000 above those of the lowest-paying states. There are some areas where it’s not low wages that drag down the standard of living but expenses that drain savings accounts, as costs of living and/or state income tax rates are much higher than the national average. In still other cases, the risks are more tangible – a couple states have work-related health incident rates that are three times the national average.

Best and Worst States to Make a Living 2017

Best states are in blue, worst states in red.

All of these financial factors are especially important if you are thinking of moving to another state, or finding a way to jump-start your career. Are things likely to be tougher or easier if you relocate? To help you look before you leap, MoneyRates.com has assembled a list of the best and worst states to make a living.

This list is based on the following factors:

  • Cost of Living
  • Workplace safety
  • State tax burdens
  • Median wages
  • Unemployment rates

Based on a combination of the above five factors, these are the best and worst states to make a living in 2017:

Full Ranking of All 50 States

Rank State Cost of Living Index Median Income Tax Rate on Average Income Unemployment Rate Incidents/100 Workers
1 Washington 107.0 43,400 0.00% 4.7 6.6
2 Minnesota 99.8 40,100 4.15% 3.8 6.2
3 Illinois 95.2 38,270 3.54% 4.9 6.1
4 Texas 90.8 35,480 0.00% 5 7.1
5 Colorado 101.0 39,710 4.63% 2.6 6.3**
6 Wyoming 91.6 38,710 0.00% 4.5 15.5
7 Virginia 100.1 39,070 4.51% 3.8 5.4
8 Ohio 92.9 35,760 1.91% 5.1 6.8
9 Michigan 93.5 36,030 3.78% 5.1 6.5
10 Kansas 90.3 34,460 3.07% 3.8 7.6
11 Nebraska 91.2 34,890 3.19% 3.1 8.8
12 Indiana 88.8 33,790 3.13% 3.9 7.7
13 Utah 92.6 35,010 4.57% 3.1 6.7
14 Wisconsin 96.8 36,250 3.52% 3.4 7.2
15 Delaware 102.5 37,960 4.04% 4.5 4.6
16 North Dakota 94.0 39,160 0.81% 2.8 15.9**
17 Iowa 91.6 34,790 4.66% 3.1 7.8
18 Tennessee 89.7 32,800 0.00% 5.1 6.9
19 Missouri 90.7 34,230 3.86% 3.9 7.4
20 Massachusetts 127.4 46,690 4.62% 3.6 5.1
21 Arizona 98.6 35,470 2.25% 5 5.5
22 Oklahoma 88.5 33,140 3.32% 4.3 8.9**
23 Georgia 91.5 34,330 4.57% 5.1 7.4
24 Idaho 89.6 32,800 4.29% 3.5 8.2**
25 New Jersey 120.8 41,950 1.84% 4.2 5.3
26 North Carolina 94.0 33,920 4.08% 4.9 6.2
27 Alaska 131.5 47,170 0.00% 6.4 8.1
28 Pennsylvania 102.7 36,680 3.07% 4.8 6.6
29 Kentucky 90.7 33,190 4.81% 5 9.2
30 Connecticut 130.5 45,090 2.89% 4.8 6.1
31 Maryland 124.8 43,010 4.05% 4.3 5.6
32 Alabama 90.2 32,100 4.88% 5.8 6.7
33 Florida 98.3 32,790 0.00% 4.8 6.5**
34 New Hampshire 119.1 38,270 0.00% 2.8 6.1**
35 Nevada 104.4 34,510 0.00% 4.8 7.4
36 Rhode Island 122.0 39,730 2.59% 4.3 4.6**
37 Arkansas 88.4 30,130 3.56% 3.6 8.6
38 New Mexico 95.6 32,900 2.50% 6.7 7.6
39 Louisiana 94.3 32,080 2.66% 5.7 7.9
40 South Dakota 98.2 31,590 0.00% 2.8 8.3**
41 Mississippi 85.9 29,590 3.09% 5 10.2**
42 New York 130.1 42,760 4.45% 4.3 5.7
43 Maine 111.9 35,380 3.23% 3 7.4
44 South Carolina 99.4 32,140 3.19% 4.4 8.5
45 Oregon 115.3 37,990 7.82% 3.8 6.4
46 Vermont 122.3 37,920 2.58% 3 7.5
47 West Virginia 95.6 30,760 3.48% 4.9 8.4
48 Montana 100.7 32,750 3.73% 3.8 11.9
49 California 143.5 40,920 2.19% 4.9 6.0
50 Hawaii 167.1 40,030 5.80% 2.7 6.1

**Data was not available for these states for non-fatal work-related injuries and illnesses, per equivalent of 100 full-time workers so the average of all other states was used.

Government Does Not Belong in Our Showers by Daniel J. Mitchell

When I write about regulation, I usually focus on big-picture issues involving economic costs, living standards, and competitiveness.

Those are very important concerns, but the average person in American probably gets more irked by rules that impact the quality of life.

That’s a grim list, but it’s time to augment it.

Showering with Disapproval

Jeffrey Tucker of the Foundation for Economic Education explains that the government also has made showering a less pleasant experience. He starts by expressing envy about Brazilian showers.

…was shocked with delight at the shower in Brazil. …step into the shower and you have a glorious capitalist experience. Hot water, really hot, pours down on you like a mighty and unending waterfall… At least the socialists in Brazil knew better than to destroy such an essential of civilized life.

I know what he’s talking about.

I’m in a hotel (not in Brazil), and my shower this morning was a tedious experience because the water flow was so anemic.

Why would a hotel not want customers to have an enjoyable and quick shower?

The answer is government.

…here we’ve forgotten. We have long lived with regulated showers, plugged up with a stopper imposed by government controls imposed in 1992. There was no public announcement. It just happened gradually. After a few years, you couldn’t buy a decent shower head. They called it a flow restrictor and said it would increase efficiency. By efficiency, the government means “doesn’t work as well as it used to.” …You can see the evidence of the bureaucrat in your shower if you pull off the showerhead and look inside. It has all this complicated stuff inside, whereas it should just be an open hole, you know, so the water could get through. The flow stopper is mandated by the federal government.

The problem isn’t just the water coming out of the showerhead. It’s the water coming into your home.

It’s not just about the showerhead. The water pressure in our homes and apartments has been gradually getting worse for two decades, thanks to EPA mandates on state and local governments. This has meant that even with a good showerhead, the shower is not as good as it might be. It also means that less water is running through our pipes, causing lines to clog and homes to stink just slightly like the sewer. This problem is much more difficult to fix, especially because plumbers are forbidden by law from hacking your water pressure.

Bureaucratic Design

So why are politicians and bureaucrats imposing these rules?

Ostensibly for purposes of conservation.

…what about the need to conserve water? Well, the Department of the Interior says that domestic water use, which includes even the water you use on your lawn and flower beds, constitutes a mere 2% of the total, so this unrelenting misery spread by government regulations makes hardly a dent in the whole. In any case, what is the point of some vague sense of “conserving” when the whole purpose of modern appliances and indoor plumbing is to improve our lives and sanitation? (Free societies have a method for knowing how much of something to use or not use; it is called the signaling system of prices.)

Jeffrey is right. If there really is a water shortage (as there sometimes is in parts of the country and world), then prices are the best way of encouraging conservation.

Now let’s dig in the archives of the Wall Street Journal for a 2010 column on the showerhead issue.

Apparently bureaucrats are irked that builders and consumers used multiple showerheads to boost the quality of their daily showers.

Regulators are going after some of the luxury shower fixtures that took off in the housing boom. Many have multiple nozzles, cost thousands of dollars and emit as many as 12 gallons of water a minute. In May, the DOE stunned the plumbing-products industry when it said it would adopt a strict definition of the term “showerhead”…

A 1992 federal law says a showerhead can deliver no more than 2.5 gallons per minute at a flowing water pressure of 80 pounds per square inch. For years, the term “showerhead” in federal regulations was understood by many manufacturers to mean a device that directs water onto a bather. Each nozzle in a shower was considered separate and in compliance if it delivered no more than the 2.5-gallon maximum.

But in May, the DOE said a “showerhead” may incorporate “one or more sprays, nozzles or openings.” Under the new interpretation, all nozzles would count as a single showerhead and be deemed noncompliant if, taken together, they exceed the 2.5 gallons-a-minute maximum.

You’ve Got to Be Kidding

And here’s something that’s both amusing and depressing.

The regulations are so crazy that an entrepreneur didn’t think they were real.

Altmans Products, a U.S. unit of Grupo Helvex of Mexico City, says it got a letter from the DOE in January and has stopped selling several popular models, including the Shower Rose, which delivers 12 gallons of water a minute. Pedro Mier, the firm’s vice president, says his customers “just like to feel they’re getting a lot of water.” Until getting the DOE letter, his firm didn’t know U.S. law limited showerhead water usage, Mr. Mier says. “At first, I thought it was a scam.”

Unsurprisingly, California is “leading” the way. Here are some passages from an article in the L.A. Times from almost two years ago.

The flow of water from showerheads and bathroom faucets in California will be sharply reduced under strict new limits approved Wednesday by the state Energy Commission. Current rules, established in 1994 at the federal level, allow a maximum flow of 2.5 gallons per minute from a shower head. Effective next July, the limit will fall to 2.0 gallons per minute and will be reduced again in July 2018, to 1.8 gallons, giving California the toughest standard of any U.S. state.

Though “toughest standard” is the wrong way to describe what’s happening. It’s actually the “worst shower” of any state.

P.S. I forget the quality of shower I experienced in South Korea, but I was very impressed (see postscript) by the toilet.

Reprinted from International Liberty.

Federal Debt is Killing Middle America by Jim Ley

For the last 10 years of my career as a public administrator, I preached fiscal responsibility for two reasons.

First, I was concerned that we were approaching a cyclical recession and I wanted to build reserves so that service levels could be maintained and property tax increases could be avoided during a challenging financial period.

Second, I was fully aware that, at best, the intertwined fiscal and monetary policies of the federal government were devaluing the purchasing price of the dollar, affecting not only municipalities’ purchasing power, but that of the taxpayer. I was concerned that municipalities’ labor forces, facing this reality, would demand more wages and that the taxpayer would be hurt even worse through increased property taxes.

Little did I know that the inevitable recession would be the worst since the Great Depression and the fiscal policies would devalue the purchasing dollar even further.

Debt machinations boil away buying power

I often wonder if we as taxpayers are clueless.

We have been conditioned to look at the ever growing federal debt number as meaningless because nothing bad seems to be happening in any visible fashion that we can translate into our lives. And we believe the politicians who spin the same stories so that they don’t have to do their real job, because it is what we want to hear.

But whether a frog is boiled to death by being immersed in boiling water, or whether it is boiled to death as the temperature is slowly increased to boiling — the frog is still dead. At least in the former case, the frog is at least incentivized to jump out of the boiling water, as opposed to adapting to the increasing but eventually deadly temperature in almost total ignorance of its imminent demise.

We have gone through a period of time where the lower and middle class in this country has seen the value, the purchasing power of their paycheck, decreased by as much as 20 percent. Retirees have seen their retirement funds sit stagnant, while the lack of return on their savings accounts permits inflation to eat into the value of their savings. They can buy less and less.

Anyone with a simple understanding of economics should be able to see what is happening. With a trillion dollar deficit each year, the federal government has to borrow roughly $83 billion a month. How does it do that?

From a little office in Washington, D.C. it auctions off that debt to bankers and governments around the world. As long as things stay relatively depressed economically, and given the good faith and credit of the United States, the interest payment demanded is kept low — thank God.

Irresponsibility will bring it to a crash

The debt doesn’t always sell, or a concern arises that too much of our debt is owned by a foreign power, possibly giving them an economic weapon.

So who buys it then? The U.S. Treasury Department looks to the Federal Reserve, which it funds through the printing of dollars, to buy the remaining debt. So more money is printed to buy the debt. The Fed now owns about $4.5 trillion in U.S. Treasury Bonds on its balance sheet. To control the supply of money in circulation, the Fed promulgates a spider’s web of regulation and control requiring banks to reserve large sums of money to cover the risk associated with future obligations.

Exploring this system of controls, and the impacts the system has had on our financial well being, would require way more space to explain than I have here.

Everyone knows that China owns a huge chunk of our debt — $5 trillion. And of course, there is the debt the Fed owns. But who do you think, what entity do you think, also owns a huge chunk of the federal debt? It is the Social Security and Medicare trust funds with $2.8 trillion. Rather than investing these funds in instruments that could return more to their trust funds, thus ensuring their long-term solvency, these funds are used by the federal government to lower the overall cost of borrowing.

If nothing else, it is a fiduciary conflict of interest. But Congress does not require itself or the federal government to operate under the same rules with which private and nonprofit fiduciaries must comply.

Too bad for all the rest of us.

Because all of these machinations combine to diminish the purchasing power of the dollar, severely impacting the working middle class.

ABOUT JIM LEY

Jim Ley has more than 35 years in public service, the last 25 of which were in top level administrative positions in two of the more dynamic counties in the U.S. Jim served two terms as President of the National Association of County administrators and was a leading “small government” voice in the profession. His administrative focus has been on financial sustainability and accountability to the taxpayer.

EDITORS NOTE: This column originally appeared in The Revolutionary Act.

Why Some Cryptocurrencies Fail and Some Don’t by Larry White

A well-known obstacle to the greater popularity of Bitcoin as a medium of payment is the high volatility of its exchange value. This volatility results from its built-in quantity commitment: because the number of Bitcoins in existence stays on a programmed path, variations in the real demand to hold Bitcoin must be accommodated entirely by variations in its unit value. When demand goes up, there is no quantity increase to dampen the rise in price; and vice-versa for a fall in demand.

Not surprisingly, several cryptocurrency developers have thought of creating a cryptocurrency with a price commitment — namely a pegged exchange rate with the US dollar — rather than a quantity commitment, in hopes of greater popularity. The aim is to create a system in which dollar-denominated payments can be made with the ease, security, and low cost of Bitcoin payments, but without the exchange-rate risk.

The development of “Blockchain 2.0” platforms has enabled the launching of a variety of new digital assets, including such dollar-pegged (and euro-pegged and gold-pegged) currencies. As we will see, the histories of early (2014-2016) dollar-pegged cryptocurrencies show a series of flops. But one project, Tether, has become a late-blooming success. Tether had $55 million in circulation as of March 29, 2017, making it the #13 largest cryptocurrency. To keep this size in perspective, a brick-and-mortar US institution with $55 million in deposits is a tiny bank or a mid-size credit union, and Tether is currently only 1/300th the size of Bitcoin.

The Tether white paper explains in more detail the motivation for developing a dollar-pegged cryptocurrency by listing advantages to individuals using it for dollar-denominated transactions rather than using dollars held in “legacy bank” accounts:

  • Transact in USD/fiat value, pseudonymously, without any middlemen/intermediaries
  •  Cold store USD/fiat value by securing one’s own private keys
  • Avoid the risk of storing fiat on [cryptocurrency] exchanges ­– move crypto­fiat in and out of exchanges easily
  • Avoid having to open a fiat bank account to store fiat value

In sum, “Anything one can do with Bitcoin as an individual one can also do with” a dollar-pegged cryptocurrency, namely, “avoid credit card [or debit card] fees,” maintain greater privacy, “remit payments globally” more cheaply, and access blockchain financial services.

But what is the claimed advantage over using Bitcoin? It is the expectation of wider acceptance in payments, because of the advantages to merchants of accepting a dollar-pegged cryptocurrency over accepting Bitcoin in a US-dollar-dominated economy:

  • Price goods in USD/fiat value rather than Bitcoin (no moving conversion rates/purchase windows)
  • Avoid conversion from Bitcoin to USD/fiat and associated fees and processes 

The Flops

First, we consider the projects that have flopped. Three projects were launched in September 2014: CoinoUSD, NuBits, and BitUSD. Their pegging mechanisms were different, and are difficult to describe briefly (partly because they were not all entirely transparent), but two common features are important to note.

  1. The rate-pegging mechanisms were not programmed into a source code, like Bitcoin’s quantity commitment, but relied on non-programmed policy actions by a trusted central authority.
  2. None used the traditional currency pegging method of having the issuer hold reserves in physical dollars or dollar-denominated debt securities. (On the NuBits mechanism see this critique by a BitUSD promoter. On the BitUSD mechanism see this critique by the CoinoUSD developer.)

We can examine the fortunes of each project by looking at its price and “market capitalization” (value-in-circulation) history on the cryptocurrency tracking site CoinMarketCap.com.

CoinoUSD

CoinoUSD, which began trading in December 2014, was developed by a for-profit payments firm called Coinomat and built on the blockchain of the NXT cryptocurrency. (In November 2014 NXT was the #6 cryptocurrency with a market cap of $19 million; currently it ranks #38 with a market cap around $13 million.) CoinoUSD reached a market cap plateau of $2.7 million in early 2016, but shut down in early 2016, due to a “payout glitch” that flooded customers with free CoinoUSD units, making it impossible to maintain the exchange value at $1. Coinomat announced a reboot in which the erroneous payout would be reversed and said, “NXTUSD will replace CoinoUSD completely, and enhance it,” but this appears not to have happened. Since then it has had a market cap of zero, and its webpage at the Coinomat site declares it “disabled until further notice.”

NuBits

The history of NuBits, also a for-profit enterprise, shows that it gained only a similarly small market foothold. Its market cap plateaued early on below $2.5 million, and since April 2015 has remained below $1 million. In June 2016 NuBits had a devaluation crisis, with the price falling to 20 cents. Its rate-pegging intervention mechanism, despite claiming many layers of reinforcement, was not robust and failed. Although the price later returned to par, today NuBits shows very little market activity. Since January 2017 the market cap has hovered around only $135,000, with daily trading volume in the neighborhood of $2000.

BitUSD

BitUSD is built on the blockchain platform of the cryptocurrency BitSharesX. Its highest market cap plateau was around $1 million soon after introduction, but it fell to below $200,000 in April 2015 and is currently less than $110,000.

BitUSD uses a novel pegging system that so far has proven robust. A piece promoting BitUSD emphasizes that “the bitUSD is an asset that is not backed by real dollar in someone’s bank account.” (It claims this a virtue: “We cannot trust anyone to hold and secure a physical asset so that people can redeem it eventually. History has repeatedly shown: It doesn’t work!” In fact, history shows the major banks in unhampered banking systems routinely justifying the public’s trust by redeeming their liabilities on demand for decades. Paypal works on the same supposedly non-working model, backed by Paypal’s dollar deposits at Wells Fargo Bank.) By contrast, BitUSD are created through collateralized forward currency contracts. The network provides an escrow service that credibly ensures repurchase (or “redemption”) of the BitUSD at or near par. Someone who wants to acquire BitUSD, say in order to buy from a seller who prefers a dollar-denominated medium of exchange, offers a contract: so many BitShares (hereafter BTS) for a certain amount of new BitUSD. Under the BitShare network rules, the acquirer must not only pay at the outset in BTS but also agree to post collateral in BTS equal to the value of the bid. If the bid is accepted by another network participant, explains the BitUSD white paper, “the collateral and purchase price are held by the network until the BitUSD is redeemed” by some third party repurchasing it. The acquirer of BitUSD thus puts 200% collateral into a contract “that only allows access to these BTS when the BitUSD are paid back.” In effect the acquirer is shorting the dollar price of BTS.

Note that the new BitUSD units are initially 200% collateralized not in dollar-denominated assets, but in BTS. If BTS fall 25% or more against the dollar, such that the value of the BTS collateral declines to 150% or less of the value to be repaid, under the network rules redemption can be compelled by any BitShares miner who “enforces a margin call.” (It should be noted that to enforce the collateral rules, the BitShares network relies on trusted human agents to inform it about the current $ price of BTS.) The system then “uses the backing BitShares to repurchase the BitUSD…thereby redeeming it.” Conversion back into dollars is thus not always at the initiative of the holder, as it is for a holder of ordinary demandable bank liabilities. Instead a BitUSD holder faces a risk of “forced settlement.” If the value of BTS falls so quickly “that the margin is insufficient, then the market price of the BitUSD may fall slightly below parity for a short time if there is insufficient demand for BitUSD relative to the supply of sellers.”

The white paper concludes: “The critical thing to understand is that BitUSD is an asset used to hedge a position in BitShares against changes in the price of USD and is not supposed to have an exact 1:1 exchange rate with USD.” A close look at the chart indeed shows that the price of 1BitUSD has not been exactly $1. It has vibrated around $1 but has not experienced any lasting devaluation. Nonetheless its clientele has declined and is currently small. No doubt this reflects in part the declining popularity of BTS, its market cap having fallen from more than $60 million in September 2014 to around $15 million today.

The Success: Tether

Now to the success story. Tether was launched in February 2015. In contrast to the previous contenders, as the chart shows, it started slowly and has grown in market cap. The series of discrete steps in its market cap path indicates that there have been a series of large purchases. The most recent step, on Wednesday, March 29, 2017, raised the value in circulation to $55 million from $45 million. Logically these are not speculative position-takings, because there are no capital gains to be had so long as the price per tether remains solidly pegged (or “tethered”) to $1. And Tether has in fact successfully maintained a steady peg throughout its history with only one small and brief blip. The steps are presumably big acquisitions for transaction use. Transactions volume in recent weeks has been running mostly in the neighborhood of at $20-40 million per day.

Tether transfers are executed using the Bitcoin blockchain. Tether’s pegging mechanism is also not programmed into a source code, but it is the traditional one: the issuer holds dollar-denominated reserve assets and pledges to redeem Tethers on demand. (Euro-Tethers have recently been introduced, but I focus here on dollar-Tethers.) According to the official FAQ, “Tether Platform currencies are 100% backed by actual fiat currency assets in our reserve account. Tethers are redeemable and exchangeable pursuant to Tether Limited’s terms of service. The conversion rate is 1 tether USD₮ equals 1 USD.”

The parent Tether firm, in other words, operates like a currency board: It holds 100%+ dollar-asset backing, and passively swaps Tethers for dollars and back again. Like a currency board, it can earn interest income by holding some of its dollar-denominated assets in interest-bearing form. The Tether white paper reveals that Tether’s dollar reserves are currently held in accounts at two major Taiwanese commercial banks: Cathay United Bank and Hwatai Bank. (Why these particular banks? “They also provide banking services to some of the largest Bitcoin exchanges globally,” they are okay with Tether’s business model, and they are experienced at compliance with Know-Your-Customer and Anti-Money-Laundering regulations.)  It adds that “additional banking partners are being established in other jurisdictions” to reduce political risk of the accounts being frozen. Tether is thus not a “100% reserve” institution in the sense of a money warehouse holding 100% literal cash reserves (which would mean Federal Reserve notes in a vault).

How does a potential purchaser of Tether verify the 100% backing claim? The website declares: “Our reserve holdings are published daily and subject to frequent professional audits. All tethers in circulation always match our reserves.” A webpage does give dollar values for assets and liabilities, but does not identify the auditors or provide copies of the audit reports, so the claim of being “fully transparent” is somewhat exaggerated. The transparency is as great as that of historical note-issuing banks, however. And perhaps the important test of trustworthiness is that Tethers have in practice been redeemed every day at par for about two years.

Dollar-pegged cryptocurrencies, by contrast to Bitcoin, separate blockchain-secured payments from the speculative holding of an irredeemable private currency. Thus they provide a potential window for learning how much of the demand for cryptocurrencies is transactional, and how much is speculative. The competition among dollar-pegged cryptocurrencies provides something of a market referendum on the relative credibility of alternative pegging arrangements. The much larger size achieved by Tether suggests (though not definitively, because other factors are also in play) a popular verdict that its pegging mechanism is more credible than those of CoinoUSD, Nubits, or BitUSD. It will be interesting to watch Tether’s progress from this point on, and to observe whether its model is copied by other entrants.

Article originally appeared in Alt-M.

Larry White

Larry White

Lawrence H. White is a senior fellow at the Cato Institute, and professor of economics at George Mason University since 2009. An expert on banking and monetary policy, he is the author of The Clash of Economic Ideas (Cambridge University Press, 2012), The Theory of Monetary Institutions (Basil Blackwell, 1999), Free Banking in Britain (2nd ed., Institute of Economic Affairs, 1995), and Competition and Currency (NYU Press, 1989).

Cut Subsidies, Get Rich by David Boaz

Ever since President Trump and budget director Mick Mulvaney released a proposed federal budget that includes cuts in some programs, the Washington Post has been full of articles and letters about current and former officials and program beneficiaries who don’t want their budgets cut. Not exactly breaking news, you’d think. And not exactly a balanced discussion of pros and cons, costs and benefits. Consider just today’s examples:

[O]ver 100,000 former Fulbright scholars, among them several members of Congress, are being asked to lobby for not only full funding but also a small increase.

As a former Federal Aviation Administration senior executive with more than 30 years of experience in air traffic control, I believe it is a very big mistake to privatize such an important government function.

On Thursday, all seven former Senate-confirmed heads of the Energy Department’s renewables office — including three former Republican administration officials – told Congress and the Trump administration that the deep budget cut proposed for that office would cripple its ability to function.

This is nothing new. Every time a president proposes to cut anything in the $4 trillion federal budget — up from $1.8 trillion in Bill Clinton’s last budget — reporters race to find “victims.” And of course no one wants to lose his or her job or subsidy, so there are plenty of people ready to defend the value of each and every government check. As I wrote at the Britannica Blog in 2011, when one very small program was being vigorously defended:

Every government program is “well worth the money” to its beneficiaries. And the beneficiaries are typically the ones who lobby to create, expand, and protect it. When a program is threatened with cuts, newspapers go out and ask the people “who will be most affected” by the possible cut. They interview farmers about whether farm programs should be cut, library patrons about library cutbacks, train riders about rail subsidy cuts. And guess what: all the beneficiaries oppose cuts to the programs that benefit them. You could write those stories without going out in the August heat to do the actual interviews.

Economists call this the problem of concentrated benefits and diffuse costs. The benefits of any government program — Medicare, teachers’ pensions, a new highway, a tariff — are concentrated on a relatively small number of people. But the costs are diffused over millions of consumers or taxpayers. So the beneficiaries, who stand to gain a great deal from a new program or lose a great deal from the elimination of a program, have a strong incentive to monitor the news, write their legislator, make political contributions, attend town halls, and otherwise work to protect the program. But each taxpayer, who pays little for each program, has much less incentive to get involved in the political process or even to vote.

A $4 trillion annual budget is about $12,500 for every man, woman, and child in the United States. If the budget could be cut by, say, $1 trillion — taking it back to the 2008 level — how much good could that money do in the hands of families and businesses? How many jobs could be created? How many families could afford a new car, a better school, a down payment on a home? Reporters should ask those questions when they ask subsidy recipients, How do you feel about losing your subsidy?

Republished from Cato Institute.

David Boaz

David Boaz

David Boaz is the executive vice president of the Cato Institute and the author of The Libertarian Mind: A Manifesto for Freedom and the editor of The Libertarian Reader.